This chapter describes the first steps with SimAssist and an example workflow.
Contents
2. Viewing and structuring data
|
Information: SimAssist does not generate any data. Accordingly, the data to be used in SimAssist must first be made available in a database. |
A new project is created using the New button in the SimAssist main menu. Once a project name has been assigned and a path for the project file has been selected, the project can be created.
The first step is to connect the existing data to SimAssist. This is done using the database definition plug-in.
After the plug-in has been added to the project content, a new tab in the plug-in window is opened by clicking on the Add button. The database type is first defined via the drop down menu.
A name for the new database connection is then assigned and the path to the database is specified in the Data source area. Click Accept changes in the menu to complete the data connection.
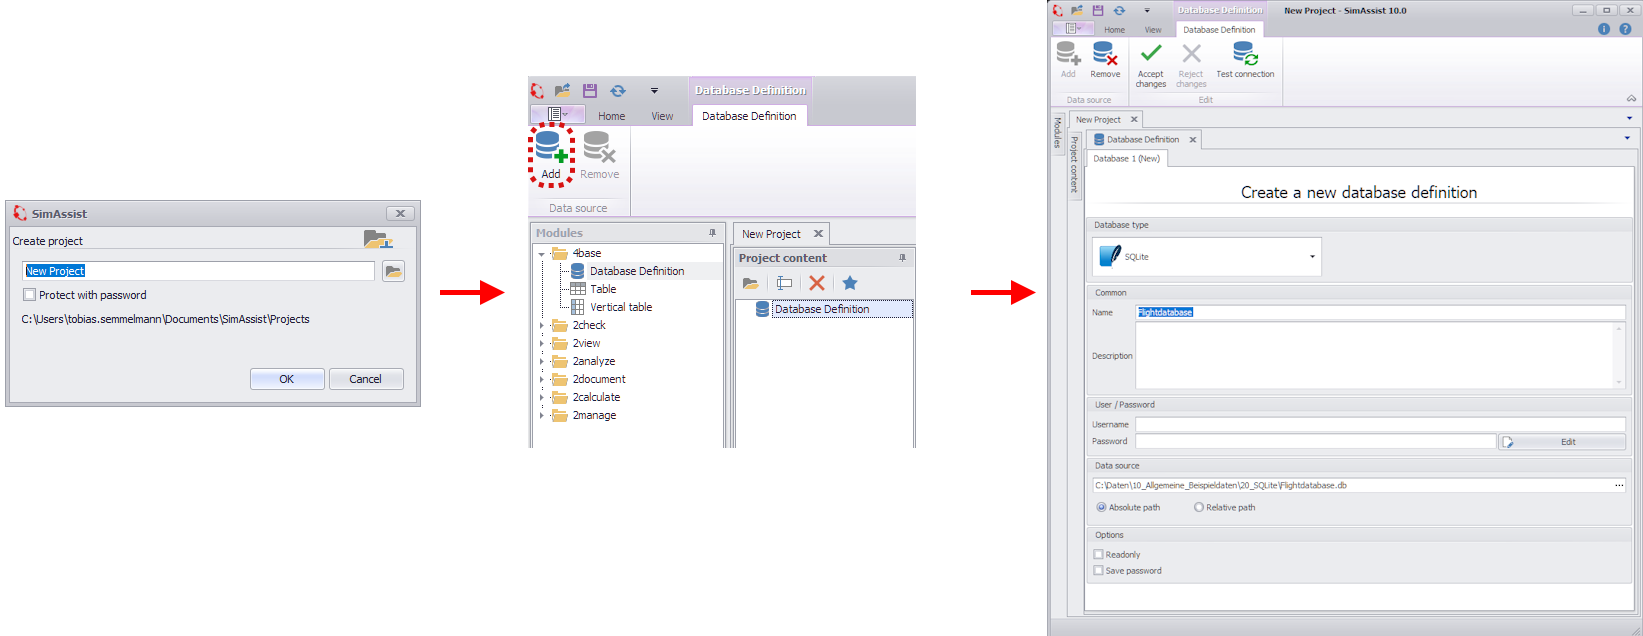
Figure 1 - Data connection
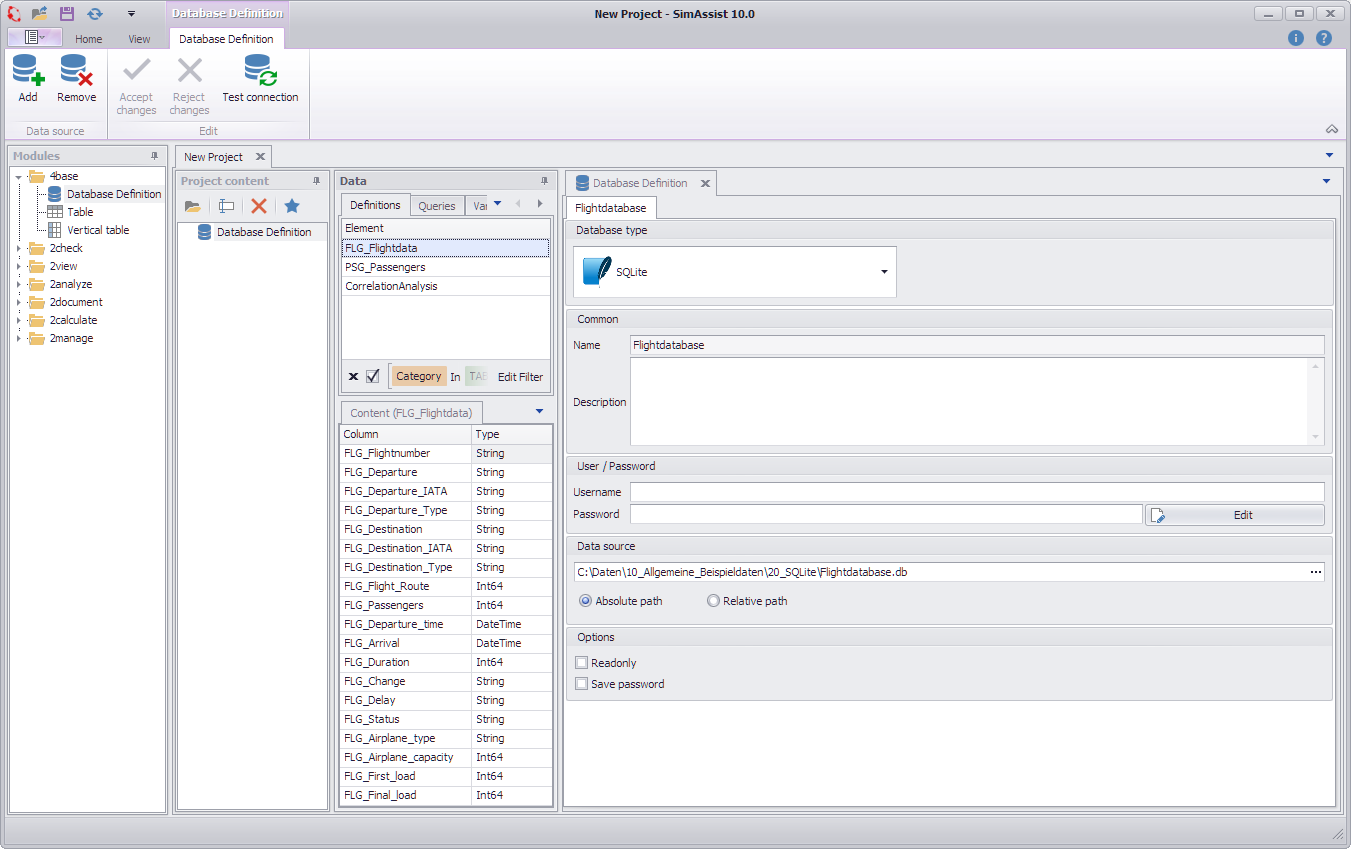
Figure 2 - Result
2. Viewing and structuring data
The connected data should now be viewed and structured using the Table plug-in.
To do this, the Table plug-in is added to the project content and then a table of the connected database from the data area is added to the plug-in (Figure 3).
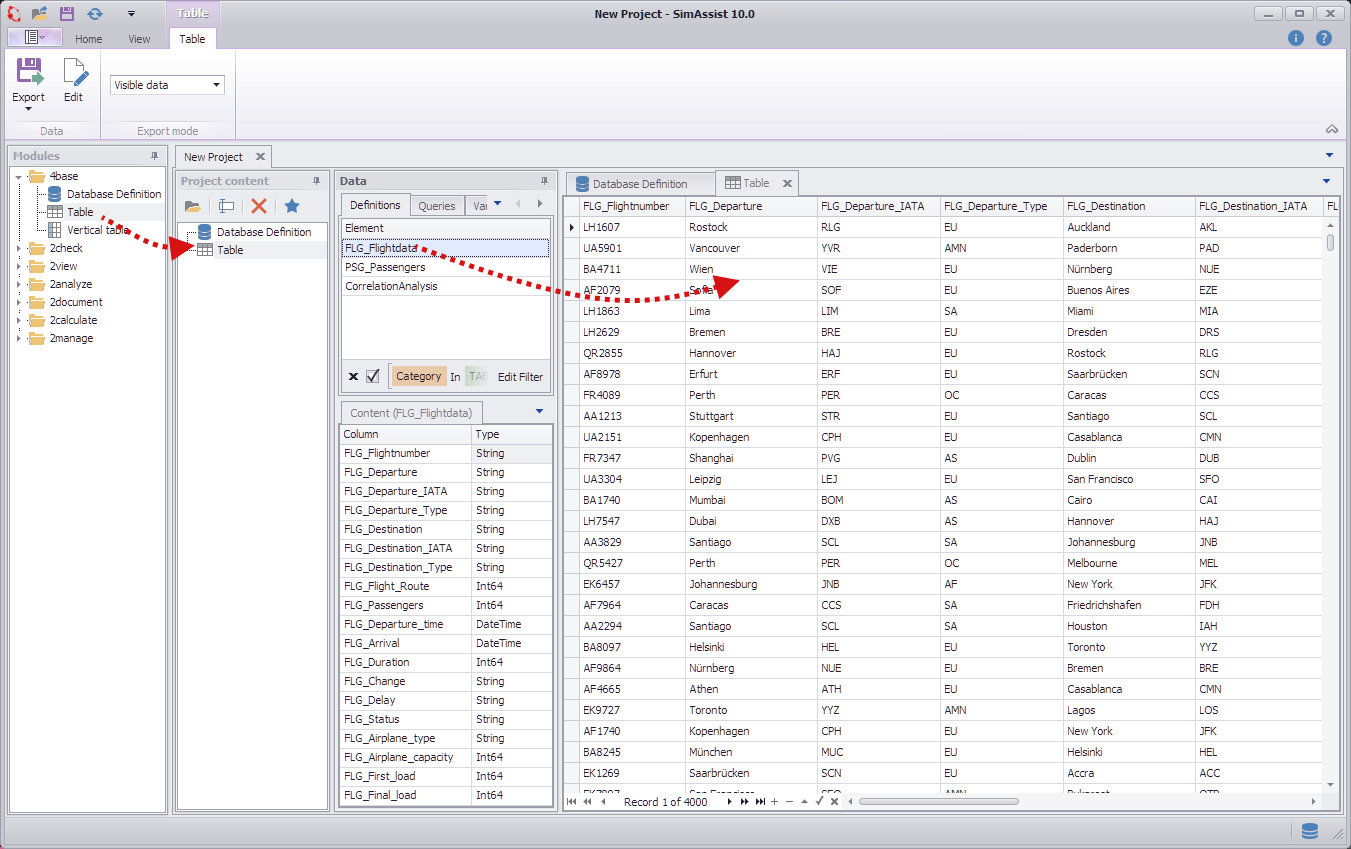
Figure 3 - Tables plug-in
To get a better overview of the data, the grouping function is used, as illustrated in Figures 4 + 5.
Using the context menu, you can either first display the grouping field and then move the desired column to it, or the grouping can be carried out directly, via the context menu entry Group by this column.
The result can be seen in Figure 6.
Figure 4 - Grouping |
Figure 5 - Grouping |
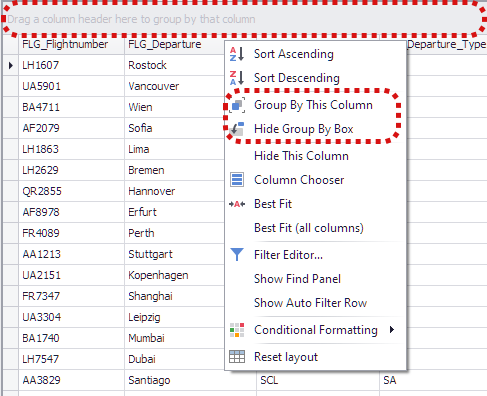
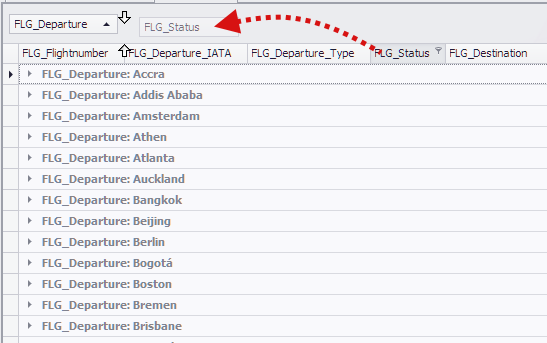
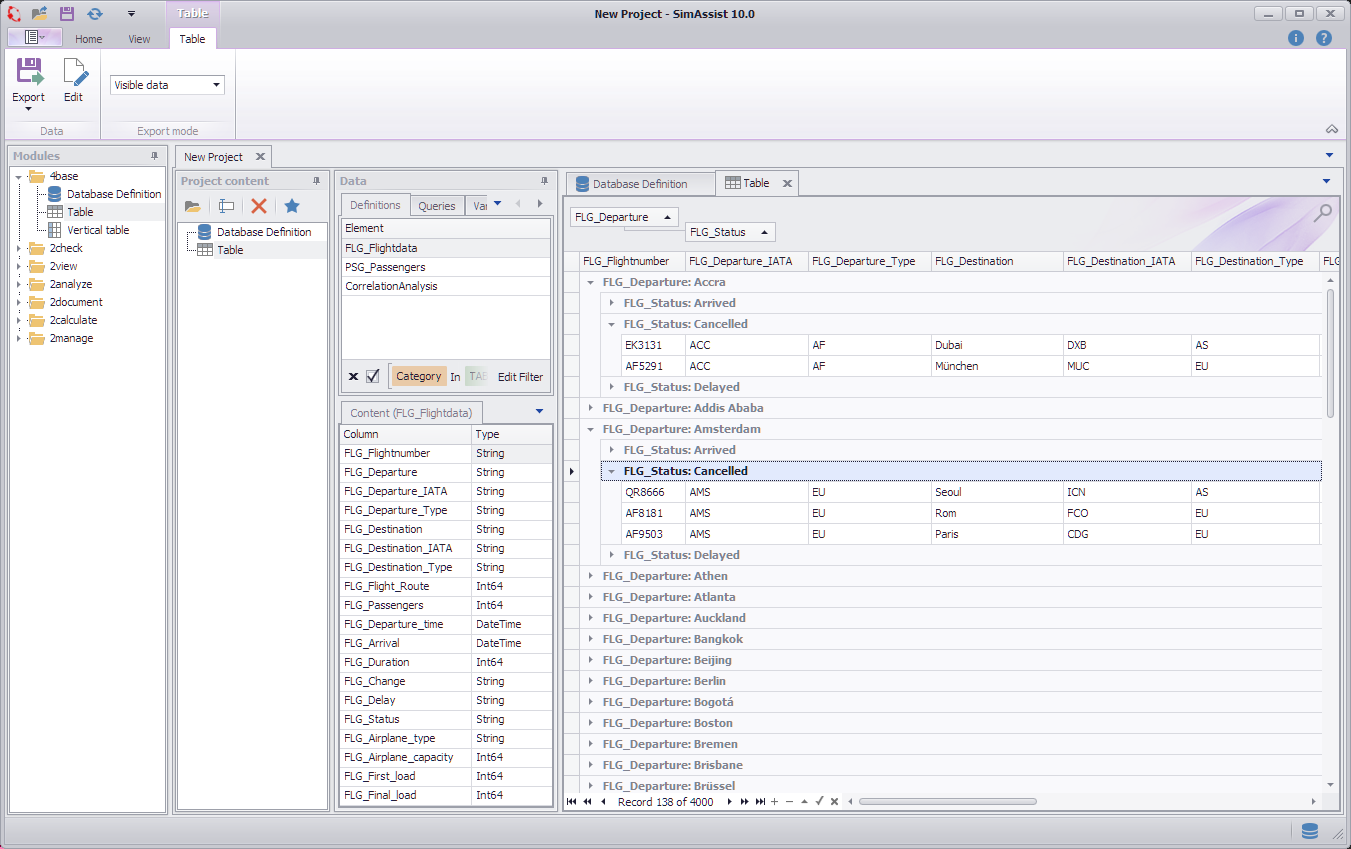
Figure 6 - Grouping result
In this step, the connected data is prepared using SQL statements and Variables. The first step is to create a text variable with the Variables plug-in, which is then to be used in an SQL statement.

Figure 7 - Creating a variable
Once the variable has been created, it is available with the corresponding name in the Variables tab in the data area.

Figure 8 - Variable created
An SQL statement is now created with the SQL statement plug-in. Once the plug-in from the 2check module has been added to the project content, a new statement can be created using the New button in the menu.
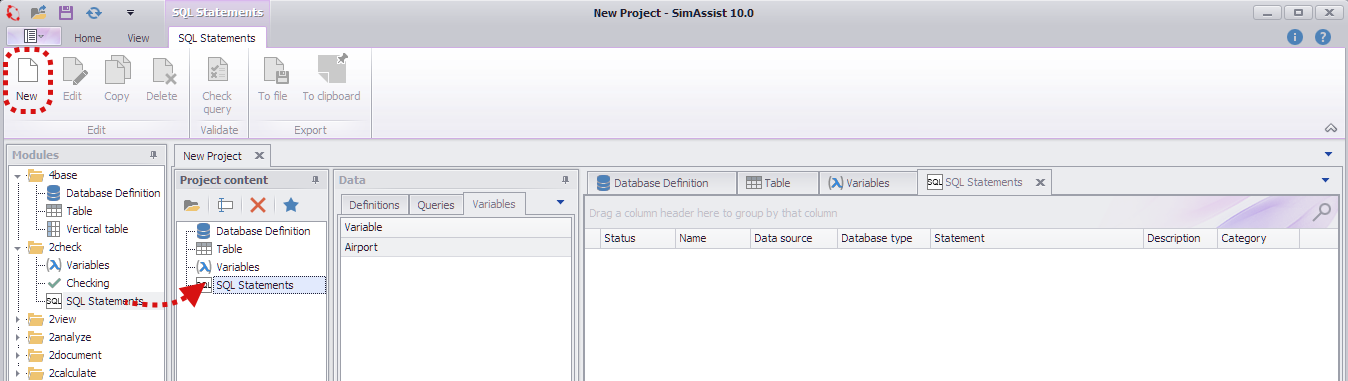
Figure 9 - Create SQL statement
A name for the new statement must be entered in the Name field; the Category and Description fields are optional.
Data is connected to the plug-in by dragging and dropping the desired table from the Definitions tab in the data area.
As soon as data has been connected to the plug-in, a default SQL statement is automatically created.
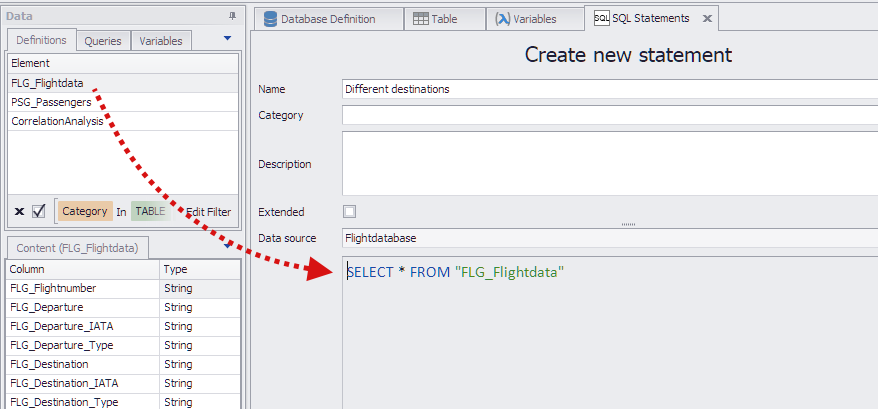
Figure 10 - Create SQL statement
The statement can then be customized as desired. In this example, two different destinations are to be filtered from the FLG_Destination column (Figure 11).
SELECT * FROM "FLG_Flightdata" WHERE "FLG_Destination" = 'Chicago' OR "FLG_Destination" = 'Frankfurt'
Clicking on Check query in the plug-in menu checks the statement just created for valid syntax (Figure 12).
Figure 11 - Create SQL statement |
Figure 12 - Check SQL statement |

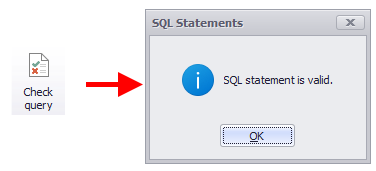
Clicking OK completes the creation of the SQL statement.
|
Information: Each SQL statement returns its own table as a result, which is now available in the Queries tab in the data area. From there, the result table/SQL statement can be used as a data source for each plug-in. |
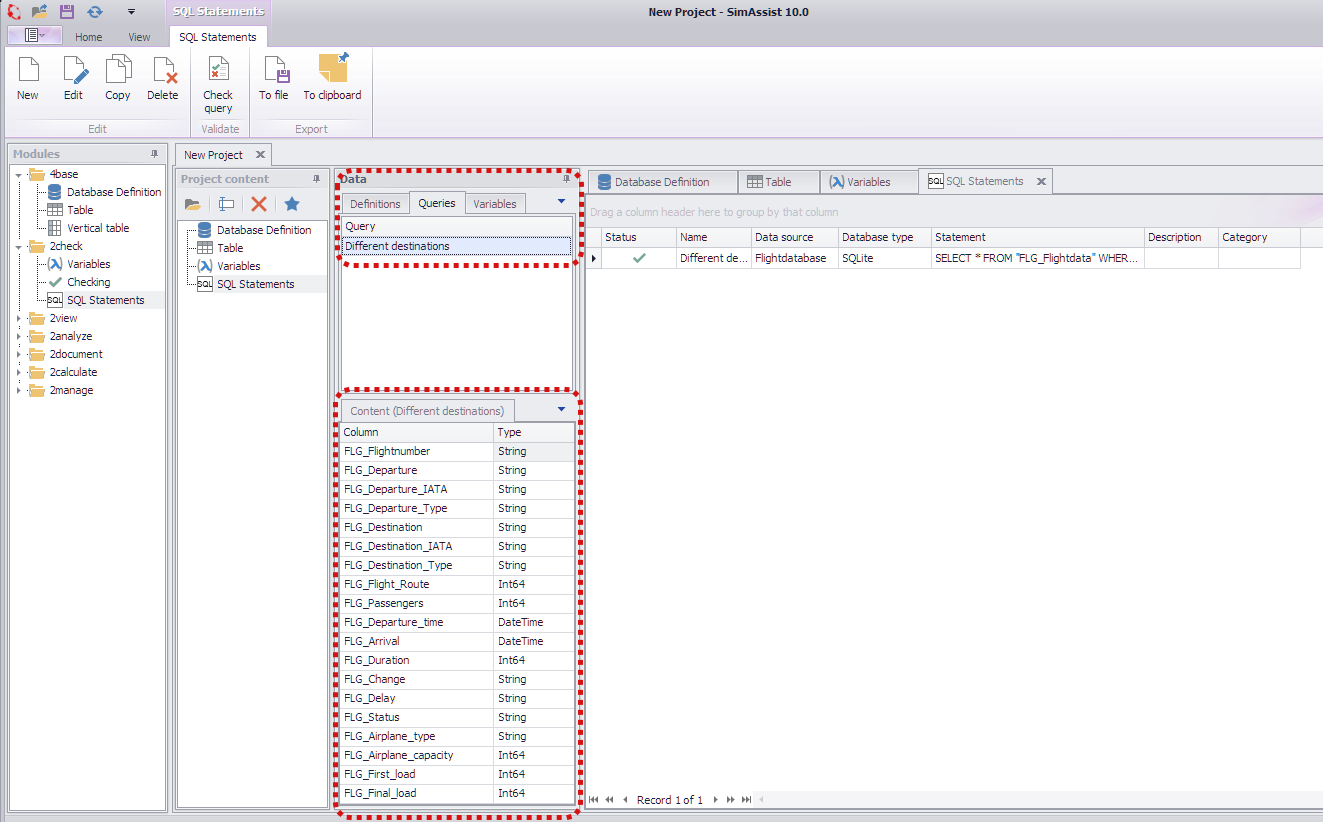
Figure 13 - Result
In Figure 14, the Different destinations table was used as a data source for a table plug-in.
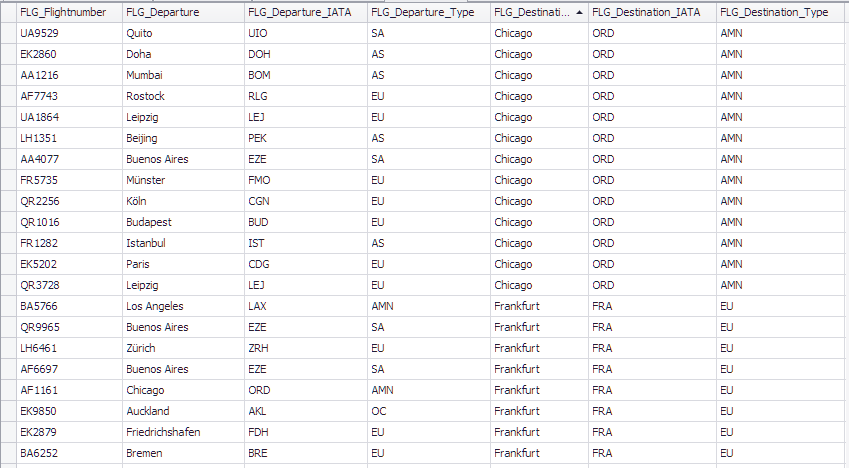
Figure 14 - Result as a table
Now the previously created variable is to be used in the SQL statement just created. To do this, the statement can be opened again for editing by double-clicking on it (or by clicking on the Edit button in the menu).
The last part of the statement ('Frankfurt') is now replaced by the variable (with the value 'München').
To use a variable in an SQL statement, it must be dragged from the Variables area to the desired position in the SQL statement.
Alternatively, the name of the variable can also be written in "||" (example: |Airport|). Figure 16 shows the SQL statement, now with the variable inserted.
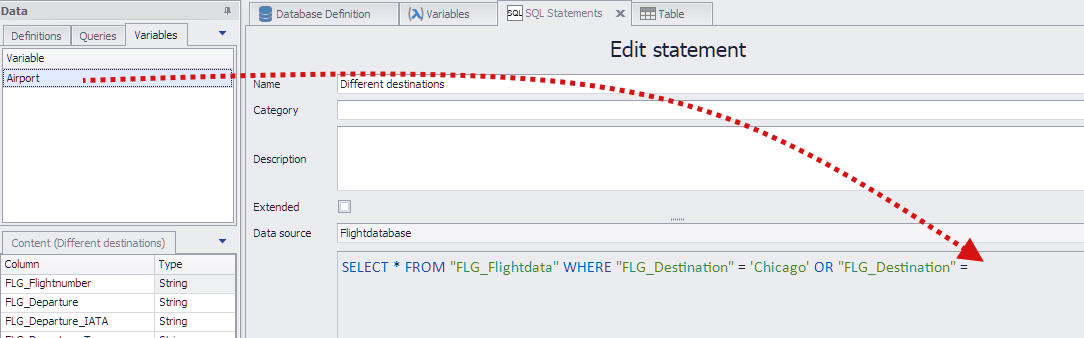
Figure 15 - Insert variable

Figure 16 - Variable inserted
The comparison of the two results in table form (left SQL statement without variable, right with variable) shows the differences. The docking functionality in SimAssist was used to compare the two table plug-ins.
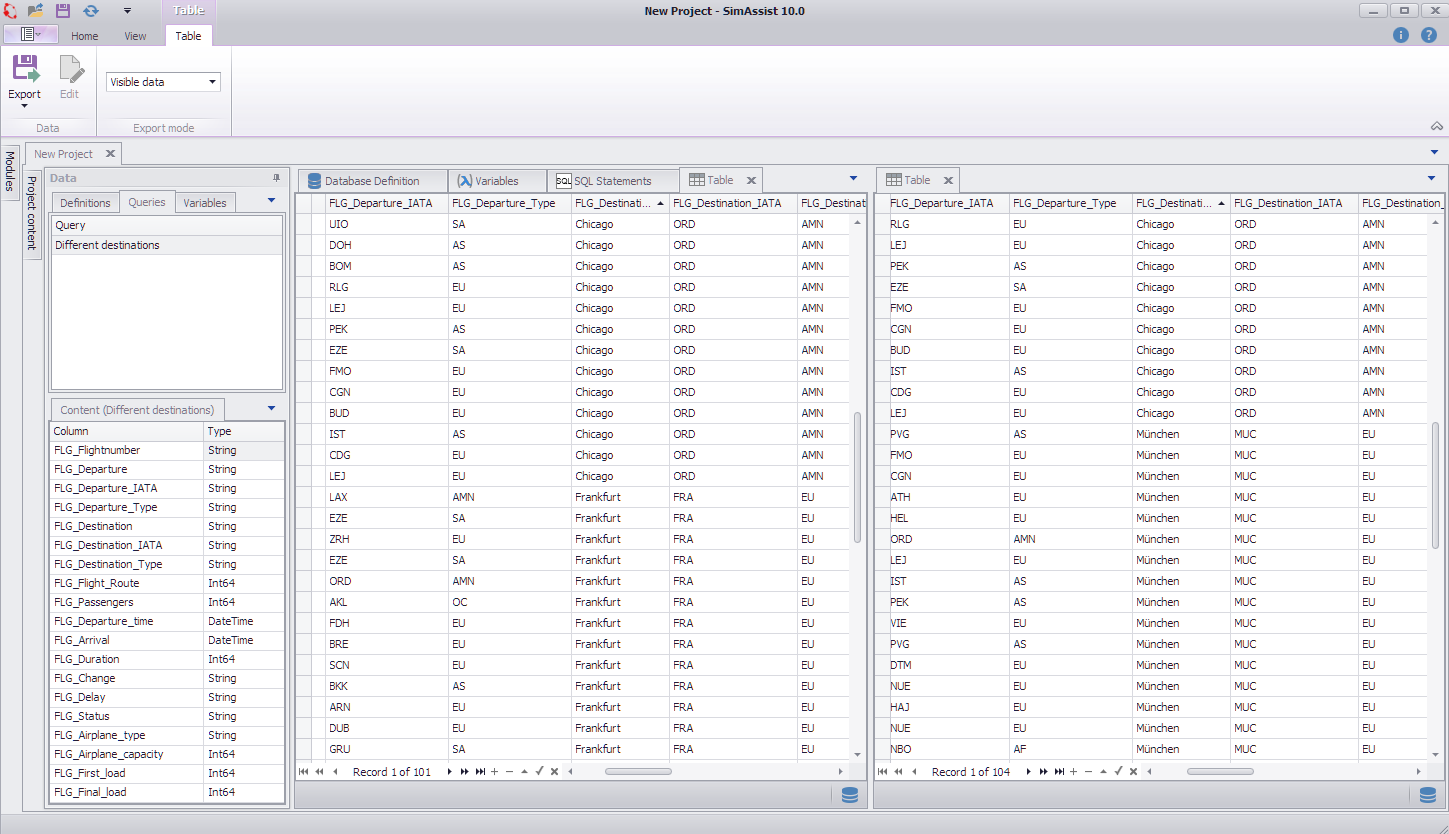
Figure 17 - Results with and without variable
In this step, data is now to be analyzed graphically with the help of the SimChart plug-in.
After the plug-in from the 2view module has been added to the project content, data is again connected to the plug-in using Drag&Drop.
In this example, the results table of the previously created SQL statement is used as the data source, which can be found via the Queries tab in the data area.

Figure 18 - Data connection to the SimChart plug-in
After data has been connected to the plug-in, the view in the lower part of the data area switches to the pivot fields.
To create a chart, the available columns of the connected data source are now distributed to the pivot fields using drag & drop as follows:
•Data area: FLG_Passengers
•Row area: FLG_Destination
•Column area: FLG_Airplane_type
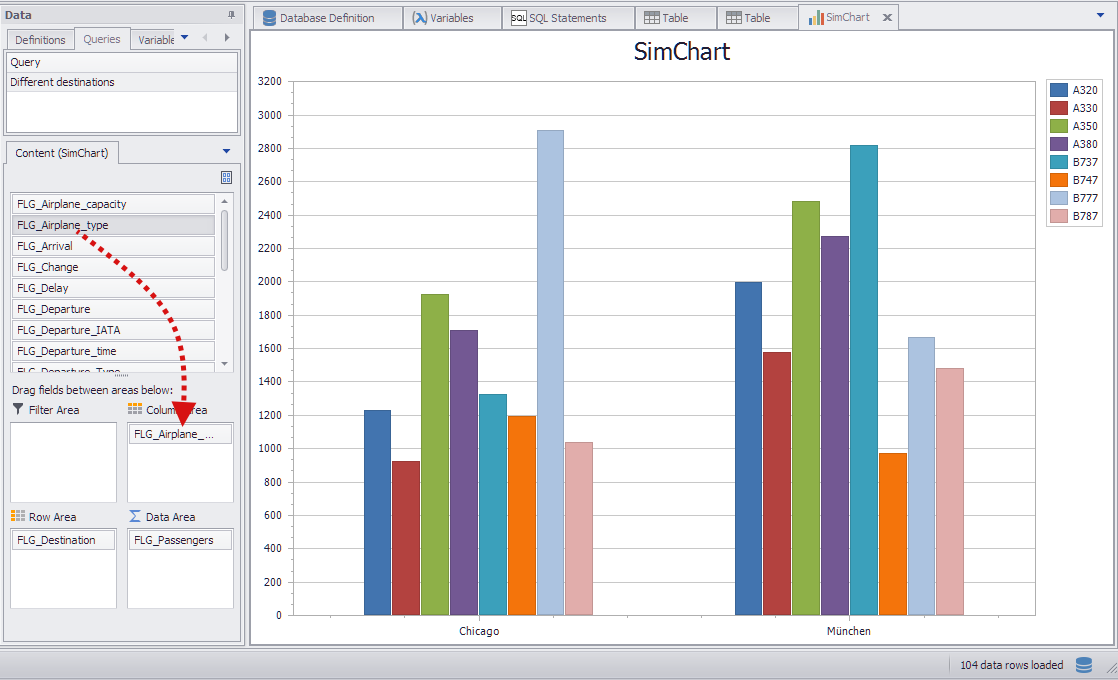
Figure 19 - Column distribution
To make the created chart easier to read, some formatting settings are made in this step. First, the chart type is changed to Grouped stacked column using the Column button.

Figure 20 - Adjust diagram type
Colors can be adjusted using the Colors button. In the color dialog, you can choose from the predefined color sets or create/import your own color set. Double-click on a color set to apply it to the current diagram.

Figure 21 - Customize colors
These can be selected from the predefined ones and displayed using the Label button
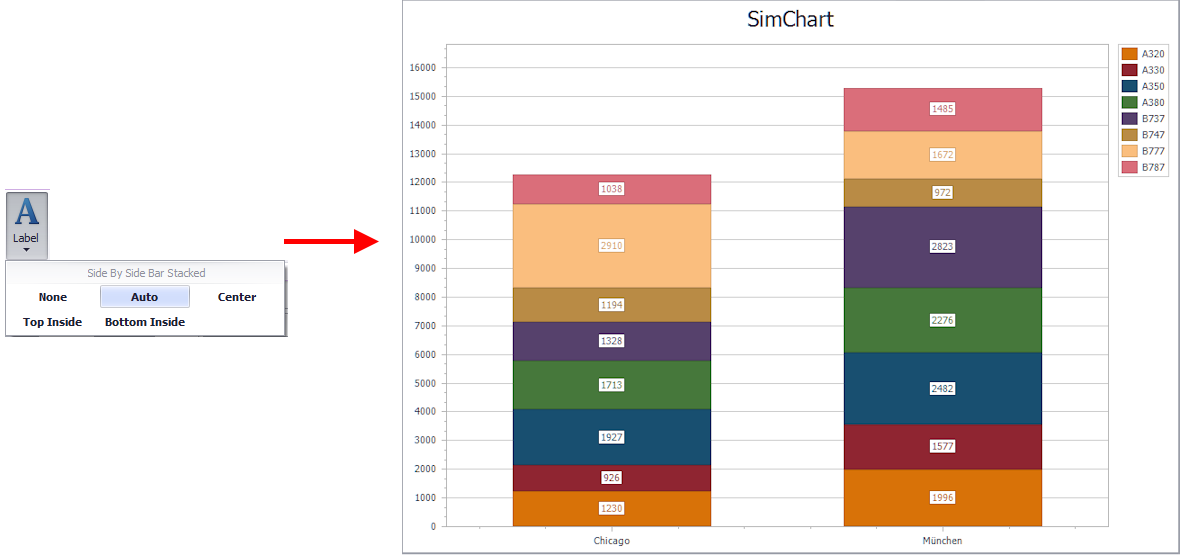
Figure 22 - Customize labeling
The last step is to customize the legend. You can choose between different combinations. The options with check box make it possible to show or hide the corresponding elements directly via the legend of the diagram.

Figure 23 - Customize legend
The last step in this work flow example is to export the results to a PowerPoint presentation.
After the PowerPoint plug-in from the 2document module has been added to the project content, the plug-ins to be exported are now added as sources using Drag&Drop.
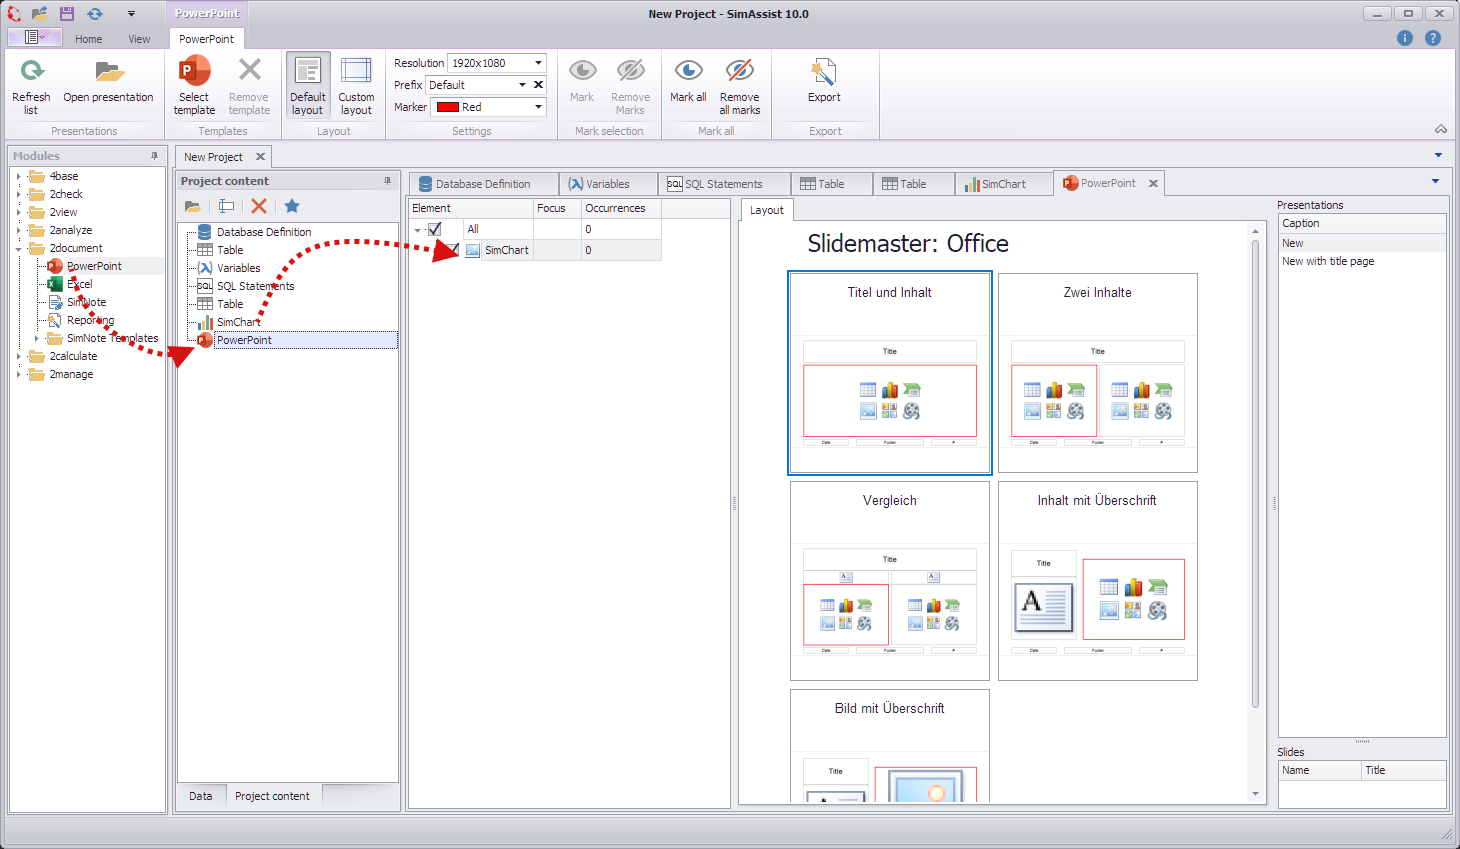
Figure 24 - PowerPoint
Clicking on the Export button starts the export and opens PowerPoint automatically, unless you have exported to an existing PowerPoint presentation.
Each source that has been added to the PowerPoint plug-in is displayed on a separate slide. This can be customized at any time.
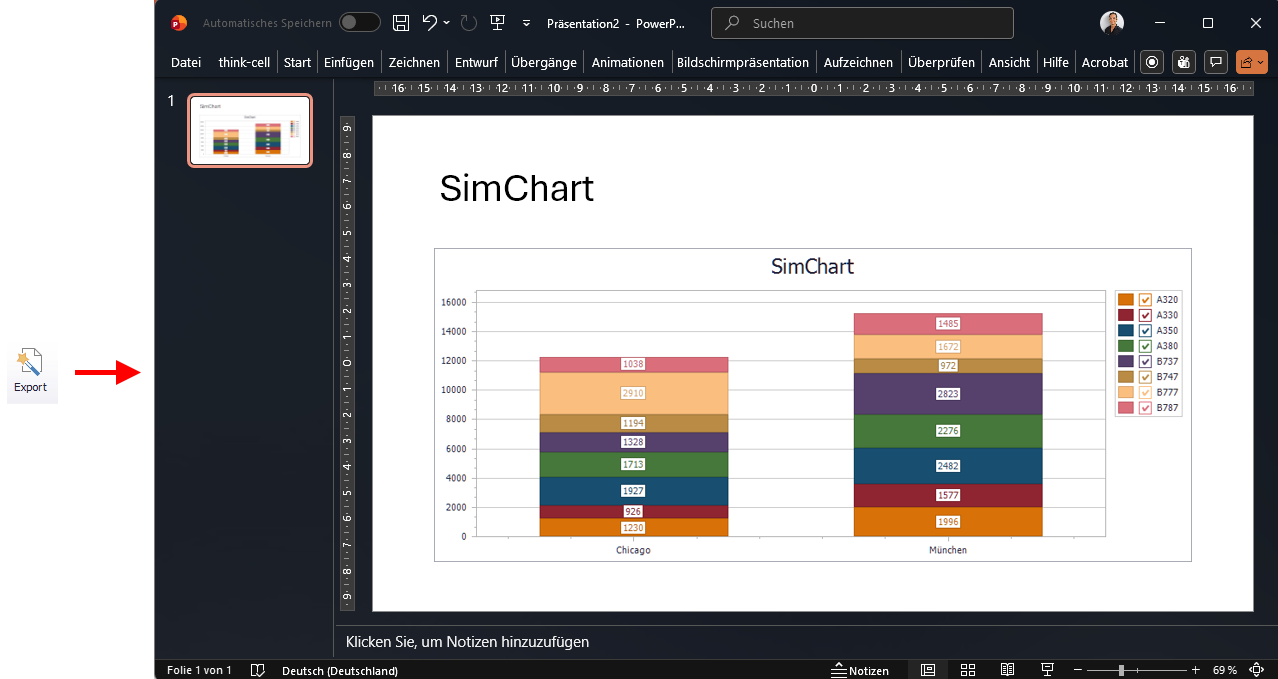
Figure 25 - Export
The last step is to display "a new series of experiments". To do this, the value of the created variable is changed from Munich to New York in the Variables plug-in.
The entire SimAssist project is then updated using the Update project button in the main menu and Export is then clicked again in the PowerPoint plug-in.
Using this procedure, different result series can be written directly into the PowerPoint presentation just by adjusting one variable.

Figure 26 - Result
© SimPlan AG - Hanau District Court, Commercial Register (Part B) 6845 - info@simplan.de - www.simplan.de/en