The main purpose of the project data area is to provide all the data you want to work with within the project.
All the data that has been connected to the project using the Database Definition plug-in can be accessed here.
In addition, the data query can be specified by means of adding not only entire tables to the plug-ins, but also individual columns, and even predefined SQL queries.
Contents
1. Layout of the Project Data Area
3. How to Position the Project Data Area
1. Layout of the Project Data Area
|
Information The data area is only available once you have added at least one data source to your project using the Database Definition plug-in. |
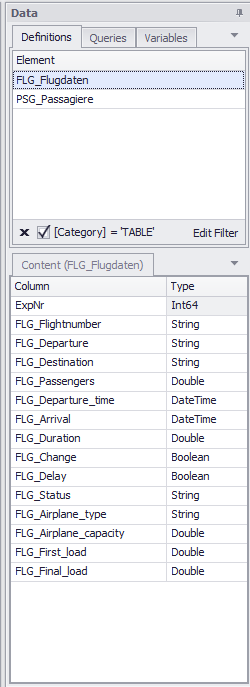
Figure 1 - Project data |
In the standard view, the Project Data area is divided into two parts. The upper half contains the data sources, i.e. the various tables of the Database Definition plug-in and - if previously created - SQL queries and Variables. The individual types of data sources can be accessed via the table bar (definitions, queries and variables) at the top.
The display of the data sources is grouped, as known from the Table plug-in. Here, the desired display can be achieved via filters and the addition of columns from the Column selection item in the context menu (can be called up by right-clicking on the column header).
The lower area shows the corresponding content of the data sources, i.e. in the case of a selected database, for example, the associated columns of the tables together with the data type. From there, the data can now be added to the individual plug-ins.
The content area is structured in tabular form and offers extensive filtering, sorting and other customization options, with the help of which you can individually adjust the display especially in the case of extensive tables. More about the customization functions can be found in the table explanations of the Table plug-in. |
If two or more databases are connected to SimAssist, it may be necessary to sort or group the displayed tables or views in the data area. This has been done automatically since version 5.0.
The display of the data sources is grouped by default, as known from the Table plug-in. The grouping field can be displayed via the context menu. This makes the grouping easier to understand.
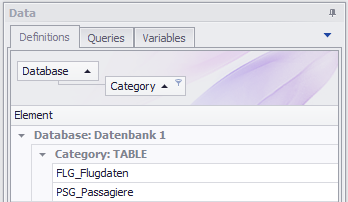
Figure 2 - Grouping Field
If another data source is added, the content is always displayed under the currently available data sources (initially in a collapsed display).
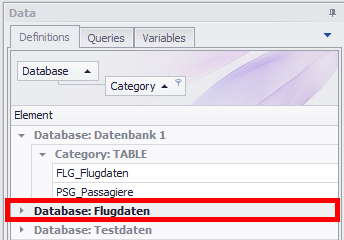
Figure 3 - New Data Source
By default, the filter is set to display TABLES as well as any queries (VIEWS) available in the database.
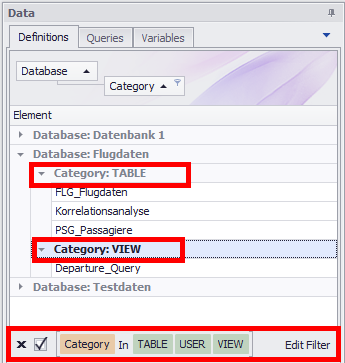
Figure 4 - Standard Filter
Depending on the database, SYSTEMTABLES or ACCESSTABLES are also available. These are hidden by default - but can be shown at any time via the filter symbol in the Category column.
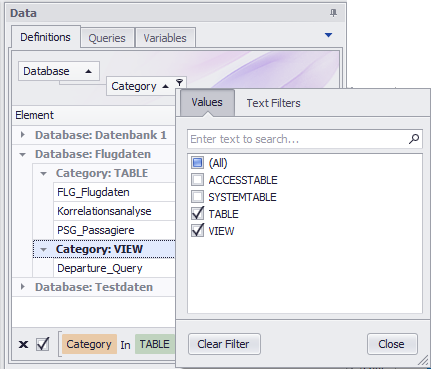
Figure 5 - Own Filters
If you are working with several databases as well as with several instances of the plug-in Database Definition, it can be useful to show the column Definition.
This column can be shown in the context menu via the entry Column selection.
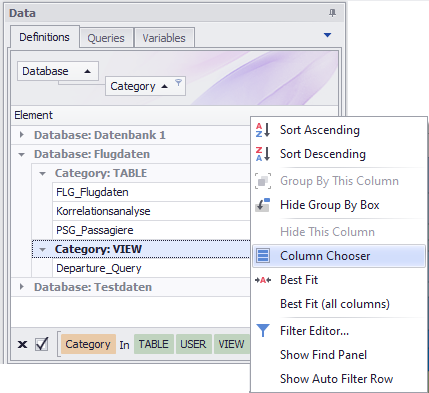
Figure 6 - Column selection
This way you can immediately distinguish between the respective plug-in instances (here "DBDEF_1" and "DBDEF_2") at first glance.
Figure 7 - Add Column |
Figure 8 - Column added |
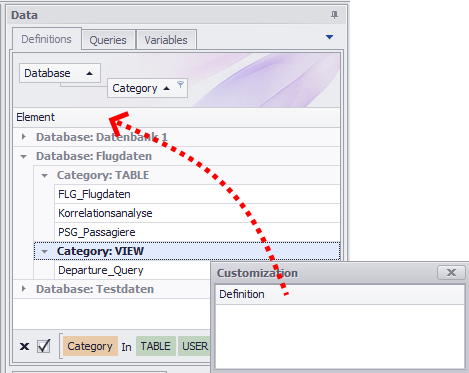
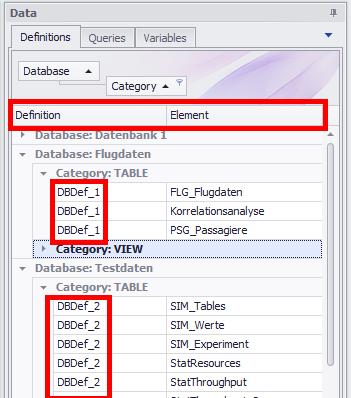
Figure 9 - Context menu in data area |
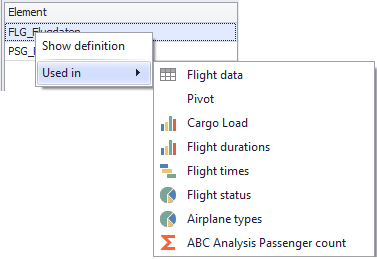
By right-clicking on an entry, a context menu appears, as in Figure 9. This context menu is available for all tabs (Definitions, Queries and Variables).
The Used in list is always calculated based on the last calls, so whenever a query is used in a plug-in, for example. To get a complete and up-to-date listing, the project can be updated.
A click on Show definition jumps directly to the respective definition.
The item Used in lists all plug-ins in which the element is used. This listing is also clickable. |
If a plug-in provides data, this can be displayed via the data provider interface and used as a data source.
The associated data is only available here as a source for other plug-ins once an evaluation has taken place within the corresponding plug-in.
Similar to the tables that originate from database definition plug-ins, you can see the individual columns in the content area of the project data (lower area) for the data provider sources.
From there, the individual columns or multiple columns can be added to the plug-ins as a data source in one step using multiple selection.
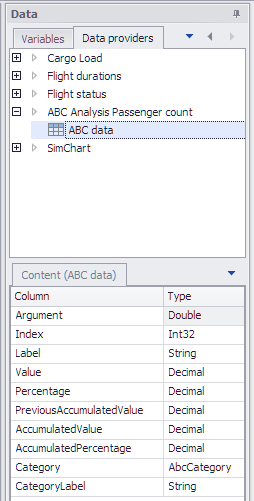
Figure 10 - Data provider interface
To add data to a plug-in, you first need to choose the Data tab in the project window. A total of three options are available for adding data:
Column
Individual columns can be added to the data pool. To this end, you first need to choose the Definitions tab in the Data window and select here the desired table.
You can then move the required columns from the Content area to the Distribution Fitting plug-in’s Data Source area using Drag&Drop.
Provided the data intended for calculating the distributions is divided between several columns, you will be able to add several columns to the data pool without any problem.
Table
Entire tables can also be added to the data pool. To this end, you need to choose the Definitions tab in the Data window.
You can then add the desired table to the Data Source area using Drag&Drop.
|
Information When adding data in this way, please in particular ensure that the relevant tables comprise only columns containing meaningful data and that no columns contain ID, for example |
Query
In addition to columns and tables, you can also further customize the data pool using queries – that is, SQL queries predefined using the SQL Statements plug-in – as output data.
To this end, you need to choose the Queries tab in the Data window. You can then add the desired query to the plug-in’s Data Source area using Drag&Drop.
3. How to Position the Project Data Area (Docking)
You can position the project data area at various places in the frame application. To find out how to move the relevant window, please see the Docking section.
First, you can position the project data area anywhere in the project window, as well as over the entire area.
You can also dock the project data area anywhere in the project window (see section 3 How to Position the Project Content Area (Docking) in Project Content)
You can, of course, also use the project data area fully decoupled from all other windows.
© SimPlan AG - Hanau District Court, Commercial Register (Part B) 6845 - info@simplan.de - www.simplan.de/en