The following comprises the SimAssist instructions for the SimChart plug-in.
Contents:
1. Introduction to the plug-in
1.2 Position in the overall software package
1. Introduction to the plug-in
The plug-in SimChart can be used to analyze data quickly, efficiently and in a standardized manner.
SimChart is a pivot-based chart that can be connected with SimAssist databases.
1.2 Position in the overall software package
The SimChart plug-in is part of the 2view module, which also contains the SimPie, SimGantt and SimVis plug-ins. SimChart is available when you license the 2view module for SimAssist.
SimChart is linked to all plug-ins involved in the data query process, specifically the Database Definition, SQL Statements and Variables plug-ins.
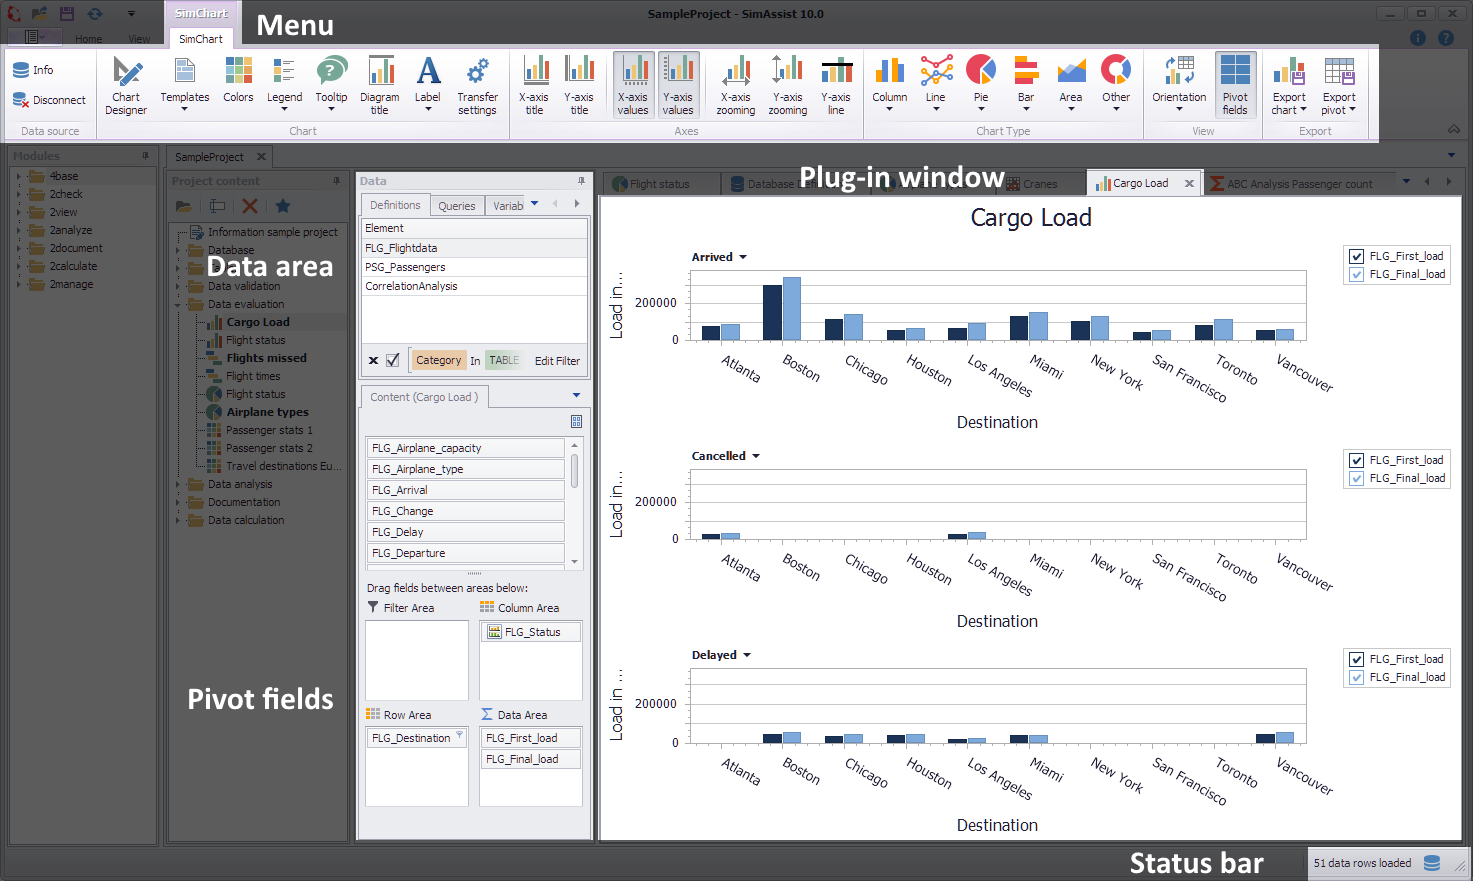
Figure 1 - SimChart Interface
The plug-in SimChart is divided in 3 main parts. In the upper area there is the plug-in menu. The buttons are grouped in categories data source, View, Chart, Chart Type, Axes and Pivot (see figure 1).
The plug-in menu is displayed, when a new plug-in entity is drawn into the project window. It is integrated into the framework menu and shows up as a new tab, when created.
Detailed instructions for the buttons located in the menu can be found in the chapter Pivot Chart.
In the Options in the main menu of SimAssist you can make plug-in specific settings (see chapter Options). The following options are available for the SimChart plug-in:
|
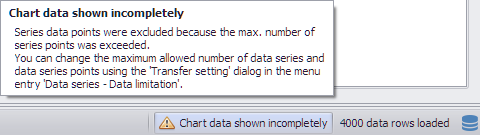
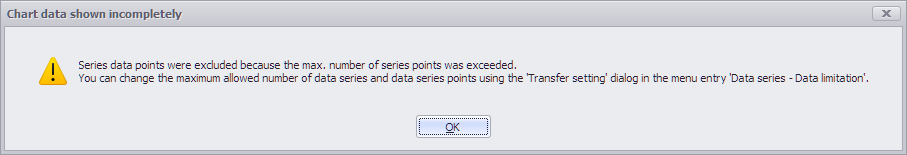
Attention Since SimAssist version 9.1, the limit for both rows and data points in the plug-in can be set in the global options. If this limit is exceeded, a corresponding message is displayed in the status bar and above the plug-in. The data that exceeds the set limit is not drawn. This setting can also be applied to other instances of SimChart via the Transfer Settings dialog.
|
Option |
Description |
Data limitation |
|
Max. number of chart series |
Maximum number of series shown in the SimChart Plug-in. Exceeding series are not visible |
Max series of data points |
Maximum number of data points per series. Exceeding data points will not be drawn |
Diagram |
|
Show end value |
Specifies the default value whether the end value of an interval is shown or not. This is applied when a new plugin-in instance is created. |
X-axis zooming |
Specifies the default value whether zooming is allowed for the diagram's panes along their X-axes. This is applied when a new plugin-in instance is created. |
X-axis: Label separator |
Specifies the separator used to separate values in labels on the X axis. |
Y-axis zooming |
Specifies the default value whether zooming is allowed for the diagram's panes along their Y-axes. This is applied when a new plugin-in instance is created. |
Grouping |
|
Complement intervals |
Specifies whether missing intervals are complemented. |
Interval type |
Determines how numeric values or dates are assigned to a range. |
Maximum interval count |
Defines the maximum interval count that can be created by the grouping. |
Substring mode |
Sets the direction of the substring operation when grouping alphanumeric values. |
PivotChart |
|
Orientation |
Specifies the default orientation for new diagrams. This is applied when a new plug-in instance is created. |
Templates |
|
Default template |
This template is applied once when creating a new instance. |
In the data area the content of the connected database is shown. To connect a database to the plug-in, select a data source in the definitions-tab and drag it into the working area (see figure 2).
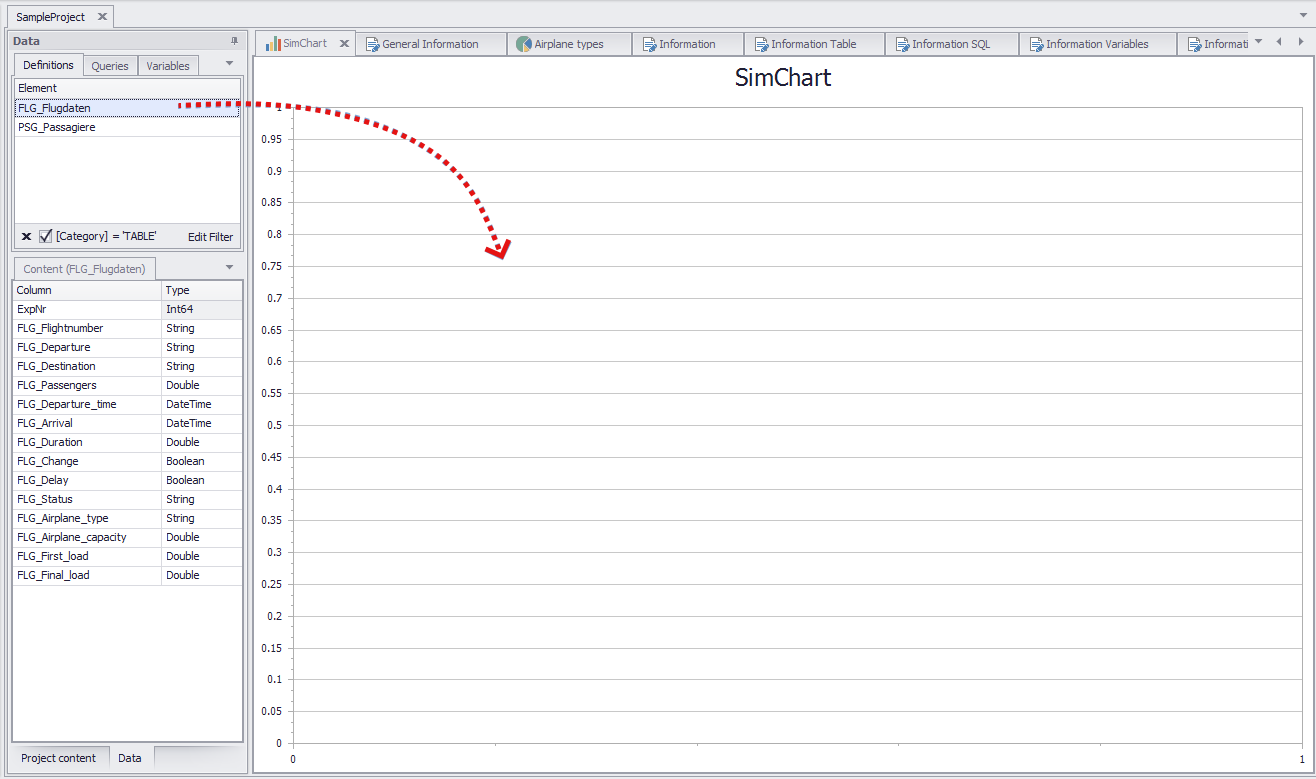
Figure 2 - Adding data
As soon as data is added, the content area is filled with it. From this area, the items can be added to the Pivot Fields, as long as these are activated in the menu (see figure 3).
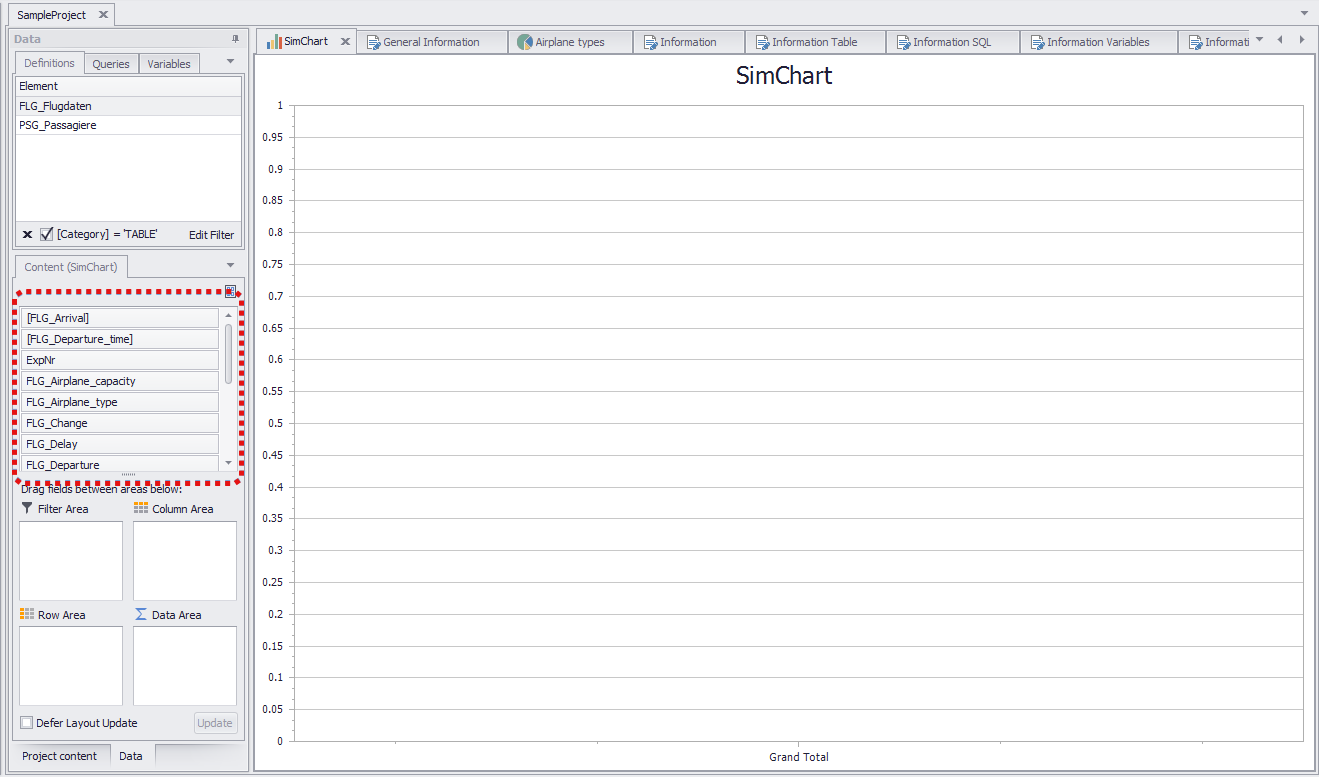
Figure 3 - Filled content area
Adding data to the Pivot Fields creates charts and pivot tables. Data can be added either via Drag&Drop or gradually via clicking the button Add to (when Pivot Fields are not active).
A detailed instruction with Screenshots can be found at Pivot Fields.
© SimPlan AG - Hanau District Court, Commercial Register (Part B) 6845 - info@simplan.de - www.simplan.de/en