Clicking the Pivot fields button shows/hides the Pivot Fields in the data area (see figure 1 and 2)
The arrangement can also be varied (see figure 3). Pivot Fields are used to created charts and pivot tables.
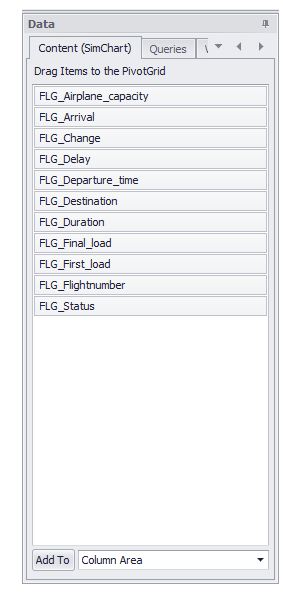
Figure 1 - Pivot Fields hidden |
Figure 2 - Pivot Fields shown |
Figure 3 - Arrangement Pivot Fields |


At first a data source must be attached to the plug-in. After that, the columns of the connected table/query are listed.
Columns can be added to the Pivot Fields via Drag&Drop. Thereby the charts and pivot tables are created (see figure 4). If the pivot table is shown, you can also drag columns in there.
Alternatively you can click on the button Add to (see figure 1) to add columns to the different Pivot Fields.
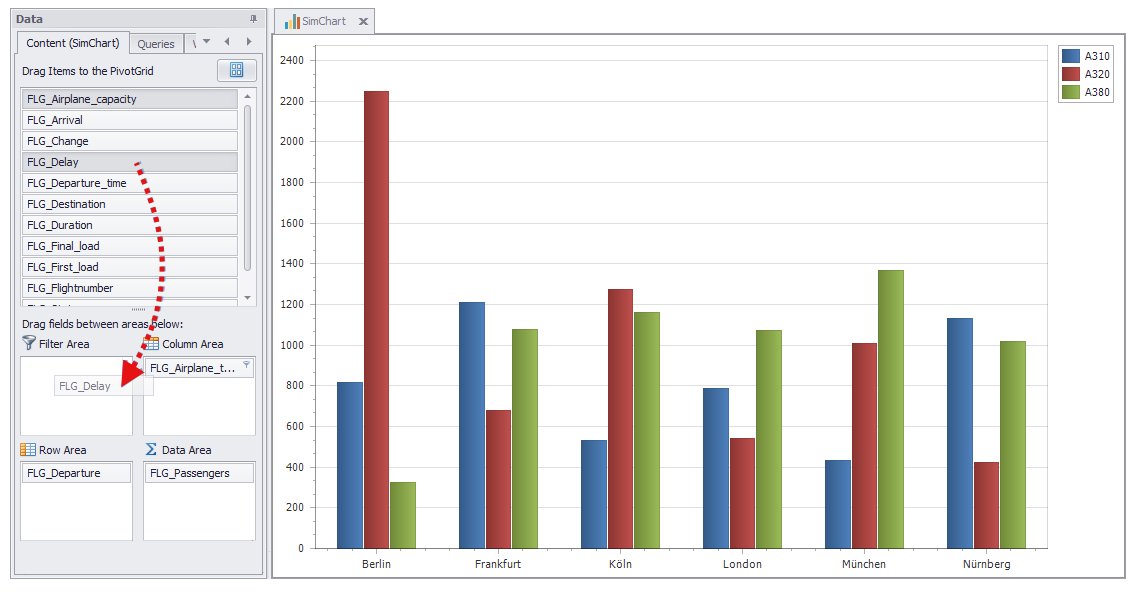
Figure 4 - Using Drag&Drop to create charts
If Defer Layout Update is active (see figure 4) the chart is not updated live.
When adding a new element to the Pivot Fields, the button Update must be clicked in order to update the chart.
© SimPlan AG - Hanau District Court, Commercial Register (Part B) 6845 - info@simplan.de - www.simplan.de/en