In this chapter the different possibilities of the user-defined grouping are shown and explained by an example.
Contents
1. Alphabetical Grouping
2. Numerical Grouping
3. DateTime Grouping
4. Options
General notes
•If a filter is set in the Pivot field before grouping, it will be reset when Alphabetical, Numeric and the four other date groupings are activated.
•The reason for this is a data incompatibility of the filter with the processed values. If the grouping is aborted and the grouping is set to (no grouping), the previously set filter will be restored. The filter will not be reset on an active group unless the grouping has been disabled.
•Grouping is only possible in the row area and column area.
•Hidden (content windows), grouped fields have no effect on the PivotChart component.
•The name of the field to be grouped is displayed in the title bar of the dialog.
•NULL values in the column to be grouped are not taken into account by the algorithm, or have to be filtered out beforehand. If NULL values exist in one column the grouping function is deactivated.
1. Alphabetical Grouping
Using the alphabetical grouping elements of the data type String can be grouped arbitrarily.

|
Option
|
Description
|
Grouping
|
Alphabetical
|
Start
|
Determines the starting point at which string values are read from the record and edited. (1-based)
|
Length
|
Determines the length of the returned string value from the starting point or start.
|
Substring mode
|
•From left: Starts the substring operation from the left
•From right: Begins the substring operation from the right |
Preview
|
If the check mark is set, every change will be displayed live in the diagram
|
|

|
Information
•Values that could not be detected by the set parameters are displayed in an axis value labeled *.
•If the length of the sub string operation exceeds the edited value, it will still be displayed. |
Figure 1 shows an alphabetical grouping with a length of 1.
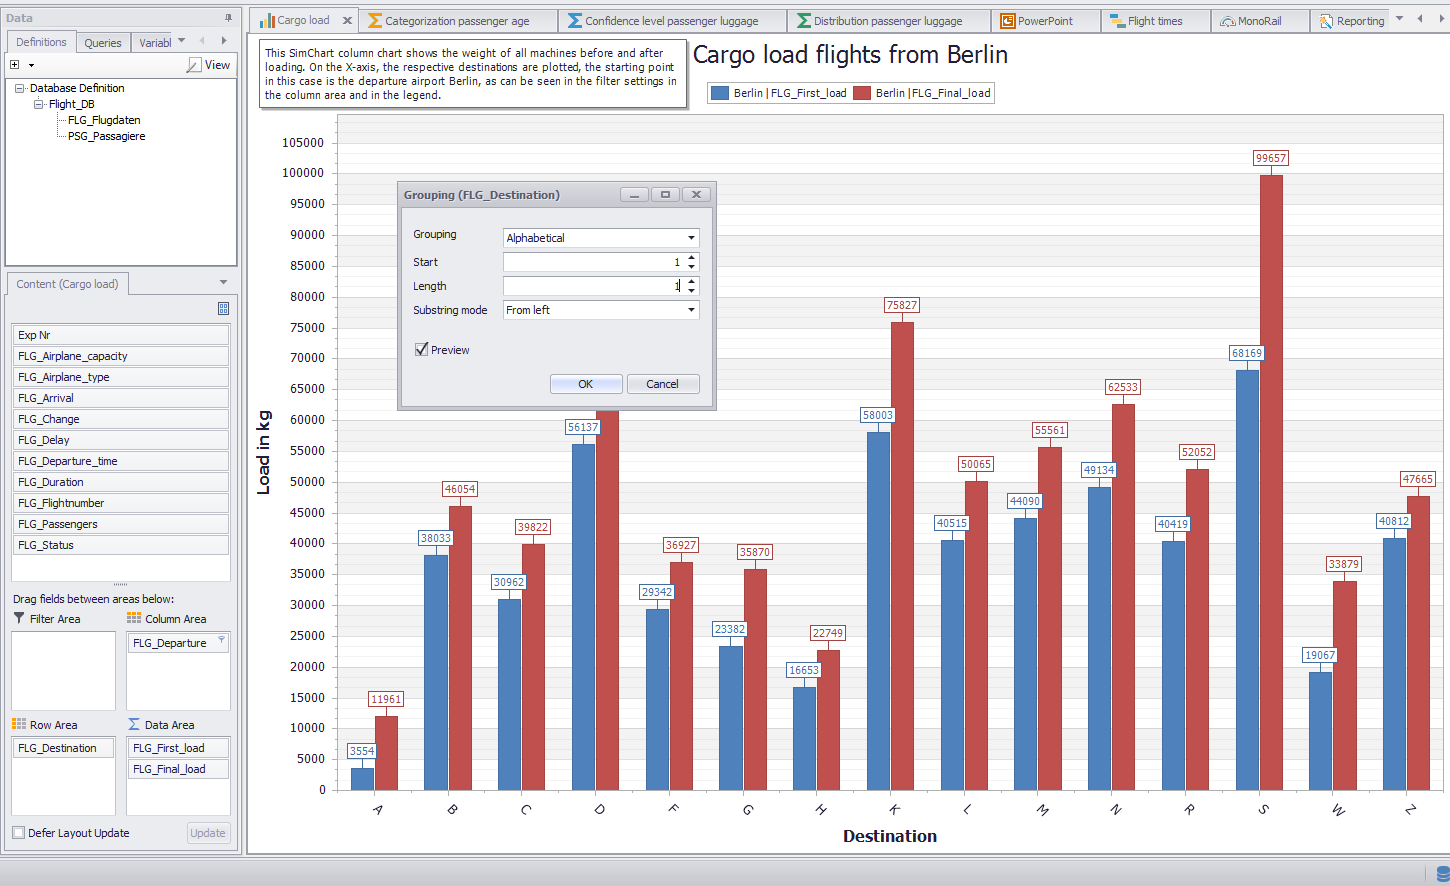
Figure 1 - Alphabetical grouping
2. Numerical Grouping
With the help of the numerical grouping elements with a numeric data type can be grouped arbitrarily.

|
Option
|
Description
|
Grouping
|
Numeric
|
Interval
|
Determines the length of the interval
|
Min value
|
Specifies the initial value at which data series are used for intervals.
Everything that falls below this value is displayed in its own axis value with a "small" or "less than" symbol.
If necessary, this axis value can be hidden via the filter of the pivot table.
•check box set: Allows manual setting of the Min value. Min values below the possible limit are automatically set to the start value of the first possible interval.
•check box not set: Disables the manual setting of the min. Value and starts the calculation of the intervals according to the smallest possible value. |
Max value
|
Specifies the final value at which data series are used for intervals.
Anything above this value is displayed in its own axis value with a "greater" or "greater than" symbol.
If necessary, this axis value can be hidden via the filter of the pivot table.
If values fall between the max value and the last interval, a last interval is generated.
The max values are then corrected using the final value of the last axis value.
•check box set: Allows manual setting of the max value. Max values above the possible limit are automatically set to the final value of the last interval.
•check box not set: Deactivates the manual setting of the max. Value and starts the calculation of the intervals according to the highest possible value. |
Interval type
|
•[Start; End [: Includes values greater than or equal to the start value and less than the end value of the interval limits.
•]Start; End]: Includes values greater than the starting value and less than or equal to the end value of the interval limits. |
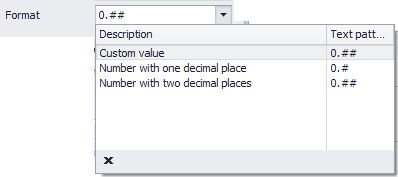
Format
|
Use the drop-down field to choose between preset formats or to manually define new formats for a text pattern
|
Show end value
|
•check box set: Final values of the respective intervals are displayed (example: see Figure 2)
•check box not set: Only one value is displayed per interval. Example: Interval from "100 - 200" --> "100" |
Complement intervals
|
The chart calculates the grouping based on the available data. If data is missing in a certain value range, then no interval is generated for it. Complement intervals specifies whether missing values in the X axis are to be added. These values can not be hidden using the filter of the pivot field.
|
Preview
|
•check box set: Changes are applied live to the diagram and displayed immediately.
•check box not set: Changes are only effective by clicking on OK. |
|
Figure 2 shows a numeric grouping with an interval of 50, a min of 100, and a max of 750.
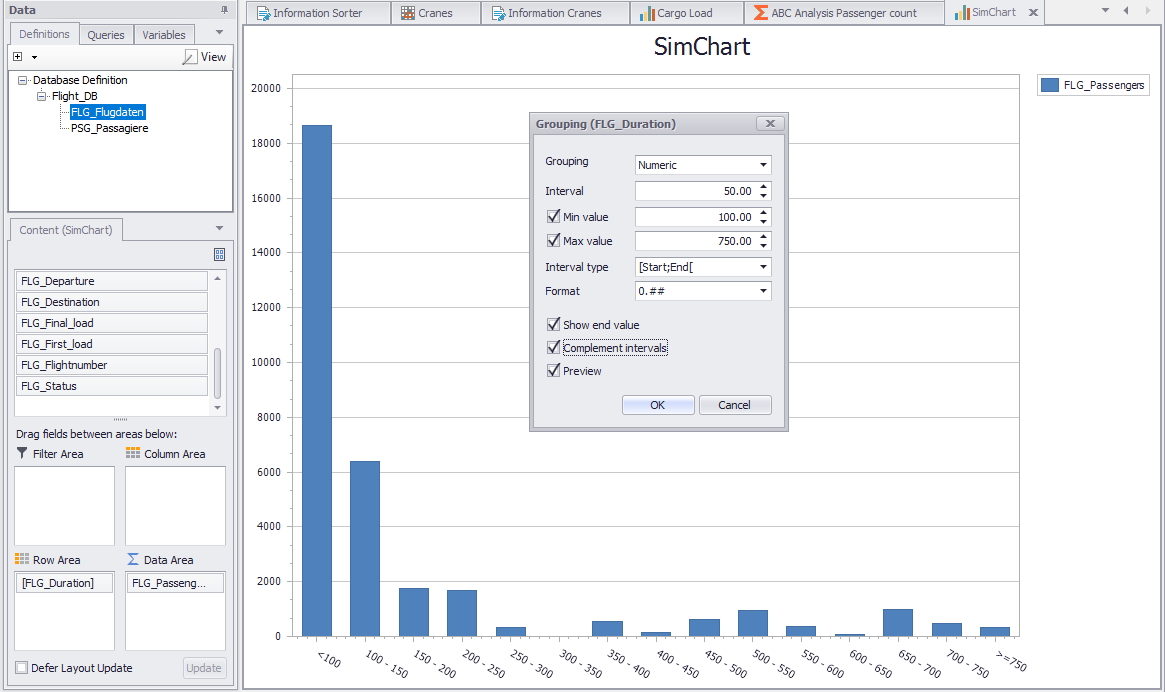
Figure 2 - Numerical grouping
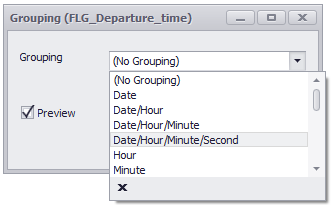
3. DateTime Grouping
|
Information:
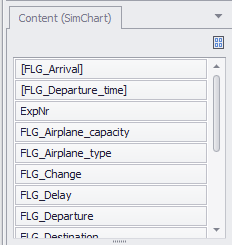
Starting with SimAssist version 4.1, date values are automatically grouped and displayed with [ ] in the content area of the pivot fields.
This display also influences the sorting of the columns in the content area.
|
|
|
Information:
The date grouping is implemented under the following entries:
•Date
•Date/Hour
•Date/Hour/Minute
•Date/Hour/Minute/Second |
|
|
Option
|
Description
|
Grouping
|
DateTime
|
Interval
|
Determines the length of the interval
|
Min value
|
Specifies the initial value at which data series are used for intervals.
Everything that falls below this value is displayed in its own axis value with a "small" or "less than" symbol.
If necessary, this axis value can be hidden via the filter of the pivot table.
•check box set: Allows manual setting of the Min value. Min values below the possible limit are automatically set to the start value of the first possible interval.
•check box not set: Disables the manual setting of the min. Value and starts the calculation of the intervals according to the smallest possible value. |
Max value
|
Specifies the final value at which data series are used for intervals.
Anything above this value is displayed in its own axis value with a "greater" or "greater than" symbol.
If necessary, this axis value can be hidden via the filter of the pivot table.
If values fall between the max value and the last interval, a last interval is generated.
The max values are then corrected using the final value of the last axis value.
•check box set: Allows manual setting of the max value. Max values above the possible limit are automatically set to the final value of the last interval.
•check box not set: Deactivates the manual setting of the max. Value and starts the calculation of the intervals according to the highest possible value. |
Interval type
|
•[Start; End [: Includes values greater than or equal to the start value and less than the end value of the interval limits.
•]Start; End]: Includes values greater than the starting value and less than or equal to the end value of the interval limits. |
Format
|
Use the drop-down field to choose between preset formats or to manually define new formats for a text pattern

|
Show end value
|
•check box set: Final values of the respective intervals are displayed (e.g. see Figure 3)
•check box not set: Only one value is displayed per interval. Example: Interval from "9:00 - 10:00" --> "9:00" |
Complement intervals
|
The chart calculates the grouping based on the available data. If data is missing in a certain value range, then no interval is generated for it.
Complement intervals specifies whether missing values in the X axis are to be added. These values can not be hidden using the filter of the pivot field.
|
Preview
|
•check box set: Changes are applied live to the diagram and displayed immediately.
•check box not set: Changes are only effective by clicking on OK. |
|
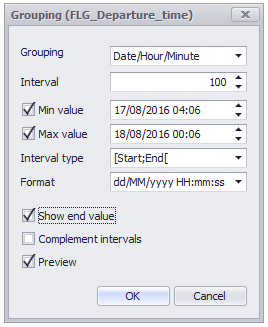
Figure 3 shows a grouping by date with a set interval of 100 minutes.
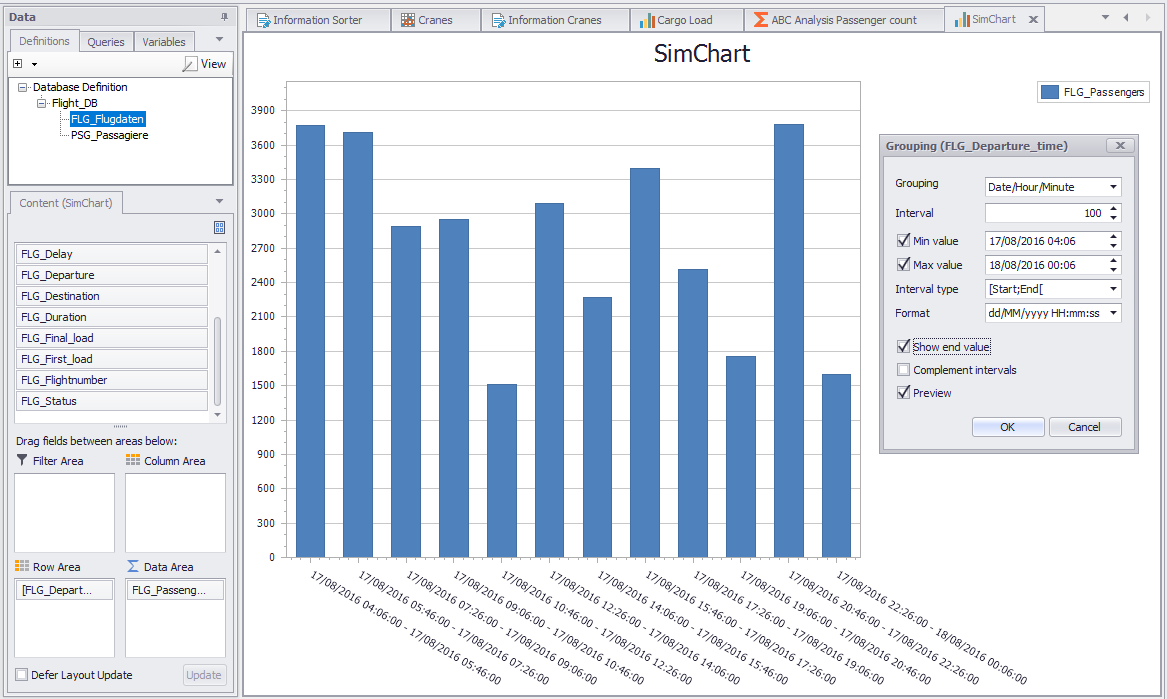
Figure 3 - DateTime grouping
4. Options
In the general SimAssist options, all plug-ins that use the PivotChart components have the same grouping settings. Figure 4 shows an example of the settings of the SimChart plug-in.
Option
|
Description
|
Diagram
|
Show end value
|
Specifies the default value whether the end value of an interval is shown or not. This is applied when a new plugin-in instance is created.
|
X-axis zooming
|
Specifies the default value whether zooming is allowed for the diagram's panes along their X-axes. This is applied when a new plugin-in instance is created.
|
X-axis: Label separator
|
Specifies the separator used to separate values in labels on the X axis.
|
Y-axis zooming
|
Specifies the default value whether zooming is allowed for the diagram's panes along their Y-axes. This is applied when a new plugin-in instance is created.
|
Grouping
|
Complement intervals
|
Specifies whether missing intervals are complemented.
|
Interval type
|
Determines how numeric values or dates are assigned to a range.
|
Maximum interval count
|
Defines the maximum interval count that can be created by the grouping.
|
Substring mode
|
Sets the direction of the substring operation when grouping alphanumeric values.
|
PivotChart
|
Orientation
|
Specifies the default orientation for new diagrams. This is applied when a new plug-in instance is created.
|
Templates
|
Default template
|
This template is applied once when creating a new instance.
|
© SimPlan AG - Hanau District Court, Commercial Register (Part B) 6845 - info@simplan.de - www.simplan.de/en