Below is the SimAssist guide to the SimVis plug-in.
|
Information As of SimAssist version 7.1, the parametrization in the SimVis plug-in has been fundamentally revised. For this reason, backwards compatibility with older versions is not possible. |
Contents
1. Introduction to the plug-in
1.2 Position in the overall software package
2.2 Parametrization in general
1. Introduction to the plug-in
Using SimVis, it is easy to recognize relationships between different data sets. There is a visualization of both the connections between data sets and the weighting of individual data sets.
1.2 Position in the overall software package
The plug-in SimVis is part of the SimAssist module 2view, which also contains the plug-ins SimChart, SimPie and SimGantt .
SimVis is available to you if you have licensed the module 2view for SimAssist.
1.2.2 Connections to other plug-ins
SimVis has links to the plug-in database definition as well as to the reporting interface (Reporting and PowerPoint).
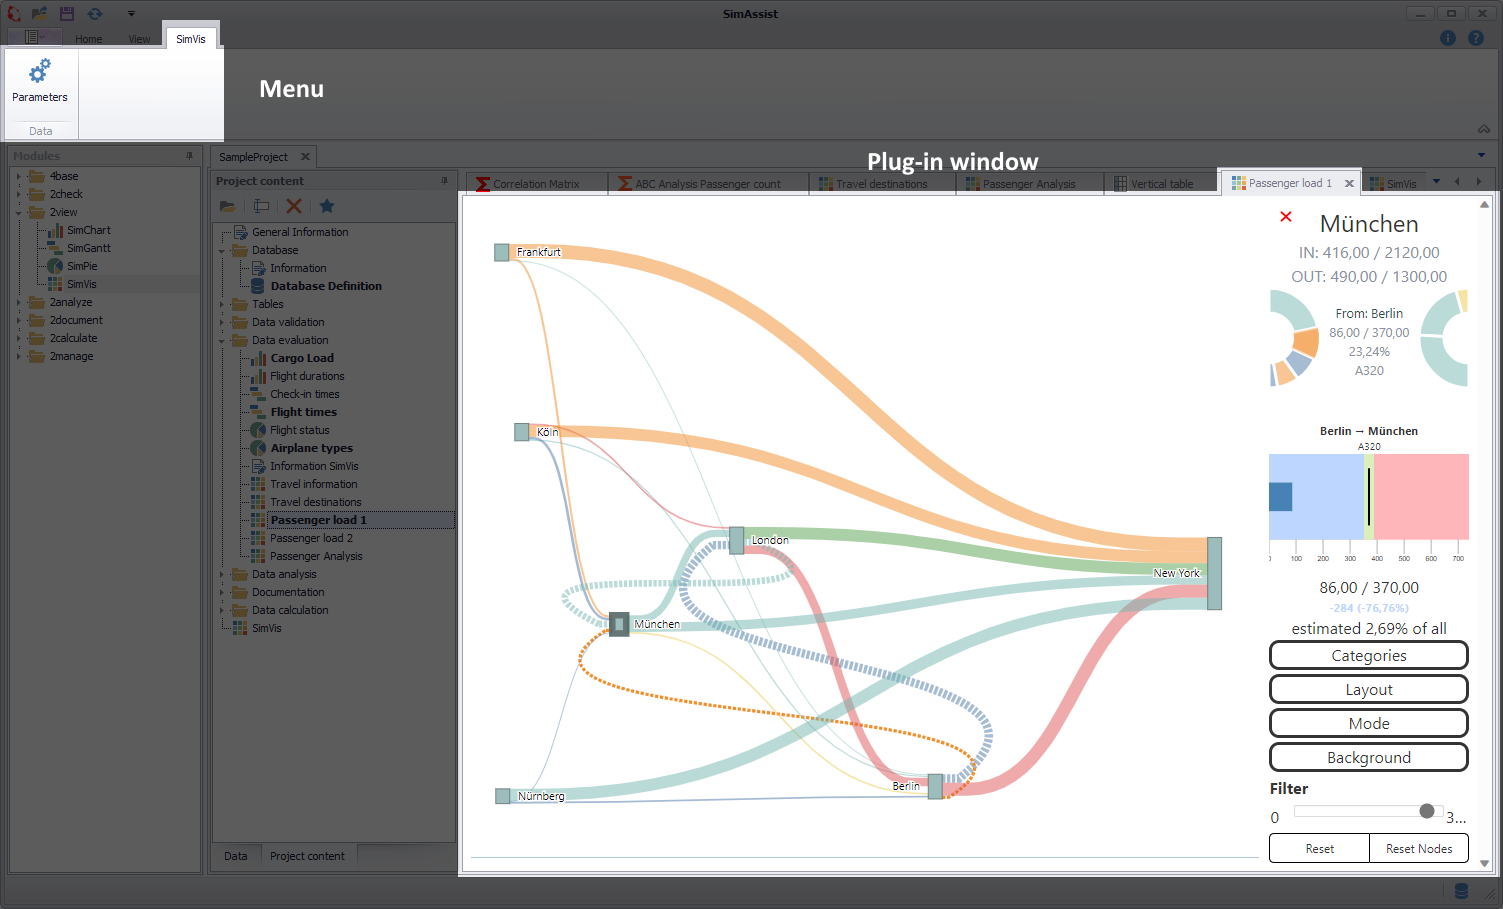
Figure 1 - Layout SimVis
The SimVis plug-in has a 2-part structure. The menu is located in the upper area. There, the selected SimVis diagram type can be parametrized via the Parameter button.
Details on parametrization can be found in the next section of this chapter and in the respective sub chapter of the chart types. The second section shows the visualizations of the respective diagrams.
2.2 Parametrization in general
Since the SimVis plug-in uses a database definition plug-in for data connection, there must first be an active data connection via a database definition instance.
Data can be added in the same way for all diagram types. The Parameter button in the menu opens the parametrization dialog, as shown in Figure 2.
First the desired chart type must be selected in the upper area, then the desired table (1) or optionally single columns (2) can be added as data source.
The button Update HTML rereads the HTML files (incl. Config-XML) in the plug-in directory to apply changes made.

Figure 2 - Adding data in general
The chart types Chord, Globe3d and Tree have a total of three, the chart type Parallel five and the chart type Sankey has seven nodes:
Chord + Globe 3d + Tree: •Start •End •Value |
Parallel: •1st column •2nd column •3rd column •4th column •5th column |
Sankey: •Starting point •Ending point •Actual Value •Desired value •Category •Additional Category •Timestamp |
After the desired data has been bound to the plug-in, the corresponding columns are listed in the Not assigned area in the parametrization dialog.
From there, the columns can now be assigned to the individual nodes using Drag&Drop (see Figure 3).
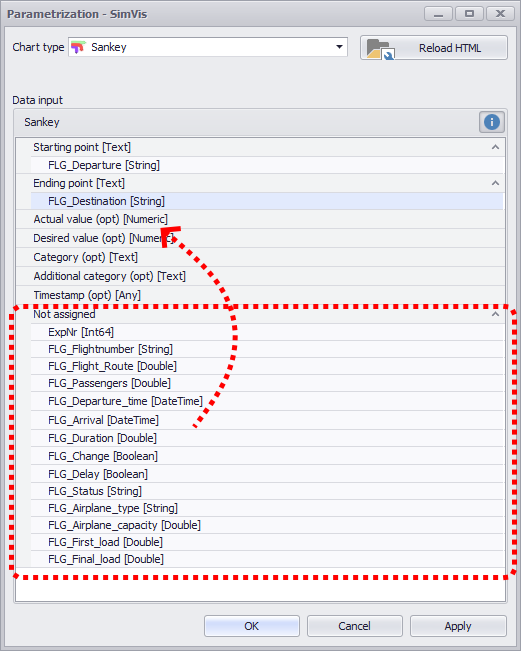
Figure 3 - Adding data to nodes
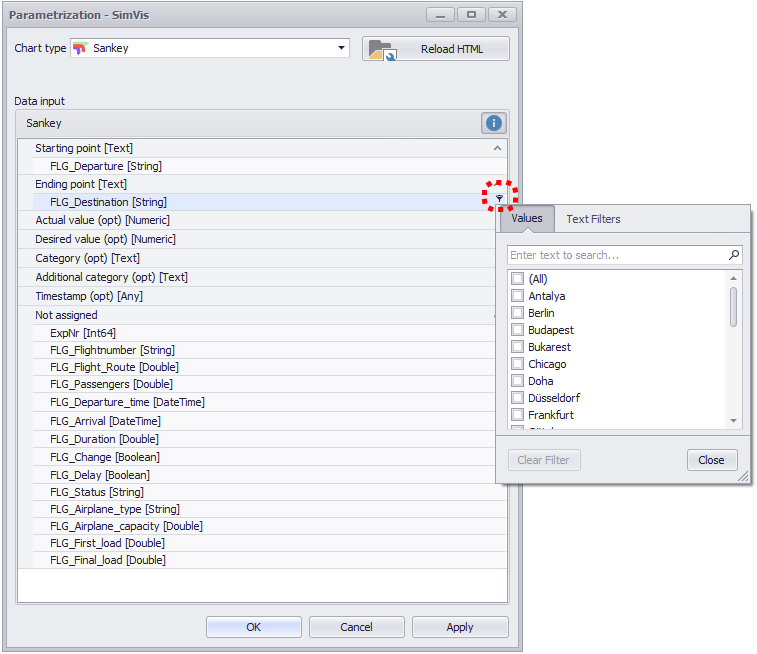
Once a column is assigned to a node, a filter can also be applied to that column. A click on the filter icon at the end of each column opens the corresponding filter (Figure 4).
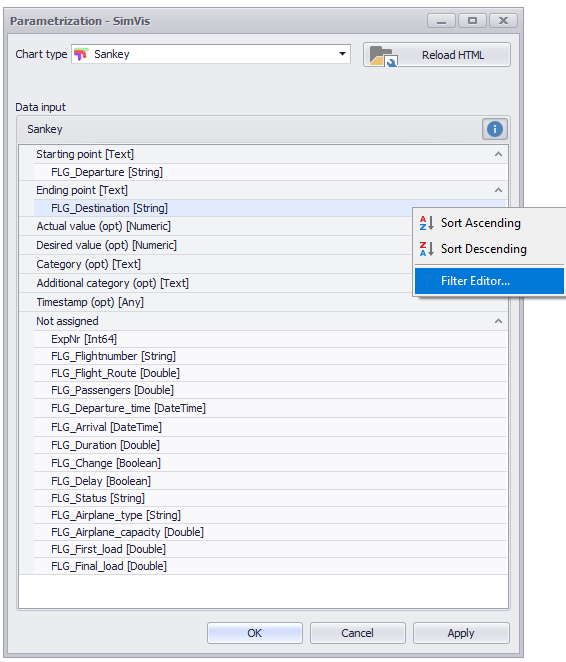
A right-click can also open the filter editor via the context menu (Figure 5). General information on filtering data can be found in the Table chapter in the Editing Filters section.
Figure 4 - Filter |
Figure 5 - Filter Dialog |
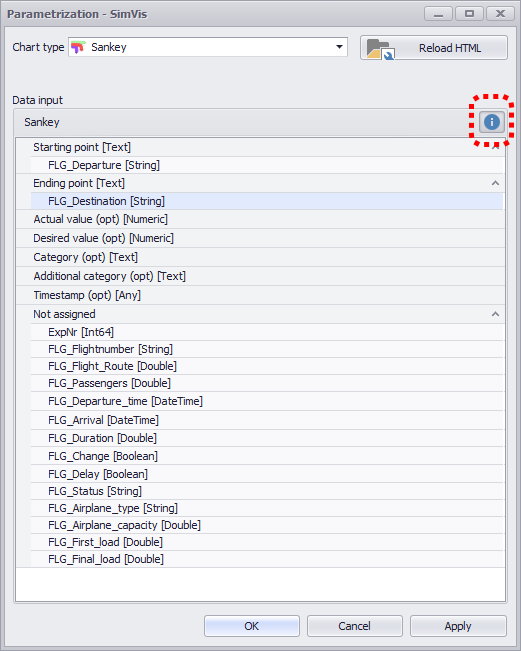
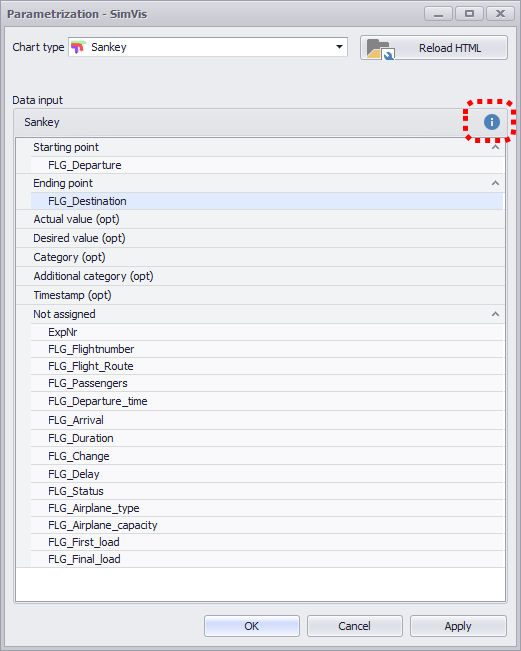
Using the blue i-Icon, additional information about the expected data type of the node and the respective data type of the connected columns can be shown or hidden (default value: shown).
Figure 5 - Data Types visible |
Figure 6 - Data Types Hidden |
© SimPlan AG - Hanau District Court, Commercial Register (Part B) 6845 - info@simplan.de - www.simplan.de/en