The Chart type Parallel visualizes multivariate data and high-dimensional structures.
Contents
The vertical lines show the axes of the coordinate system (see Figure 1). Unlike in the scatter plot, where two coordinate axes are arranged at right angles to each other, here they are parallel and equally spaced.
Each line from left to right corresponds to a data point and is represented by a polygon with corners on the parallel axes. The position of the corner on the i-th axis corresponds to the i-th coordinate of the point.
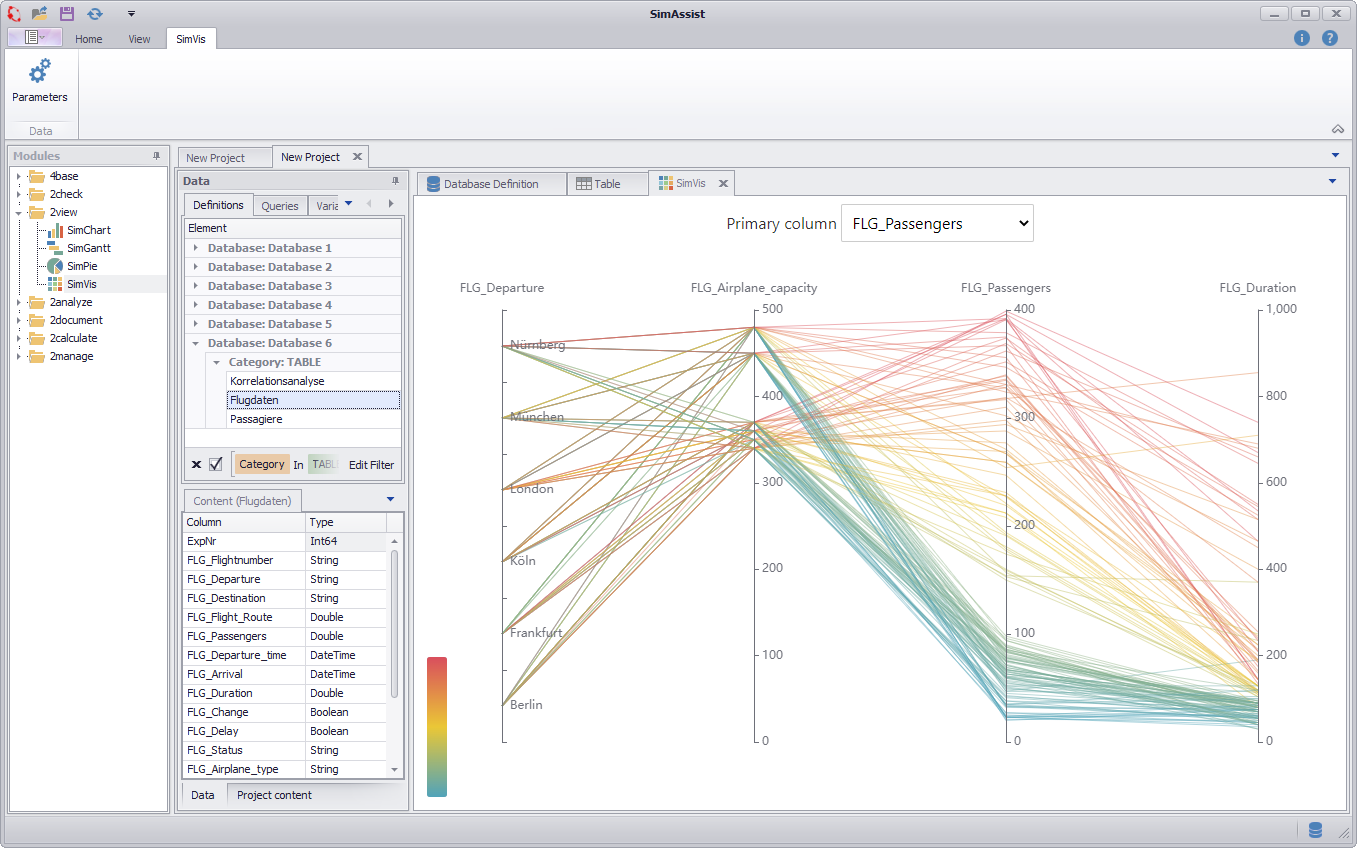
Figure 1 - Overview
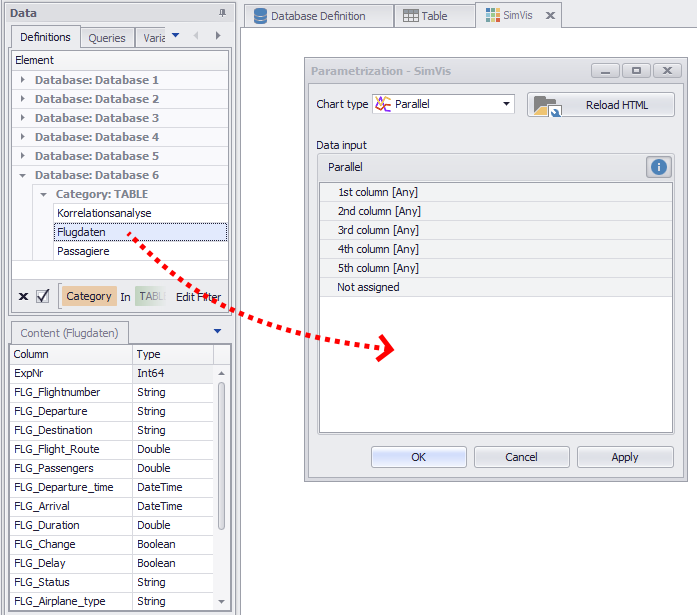
It is important how you distribute the individual columns of your data source to the different nodes - this directly affects the visualization.
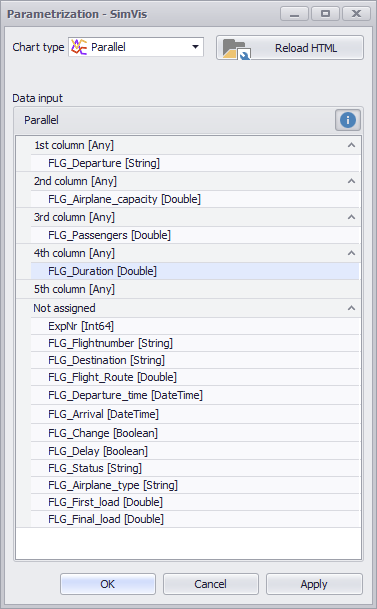
There are five different nodes available, as shown in Figure 2. In order to draw a chart, at least two of the available areas must be filled with columns.
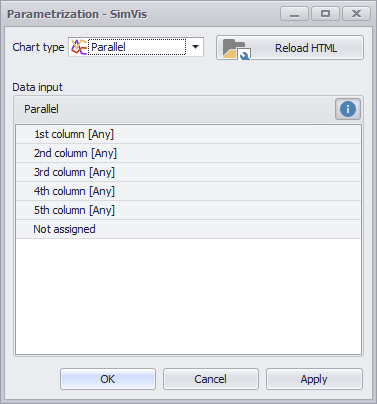
Figure 2 - Nodes
As soon as you have distributed the columns to the different nodes, you can create the diagram by clicking on OK or Apply.
Figure 3 - Adding data |
Figure 4 - Distribute columns |
Once the chart has been drawn, the Primary column can be selected using the drop down in Figure 5.
Based on this column, the diagram will be colored and the values can be read using the display located on the left. The currently focused values are highlighted in the diagram.
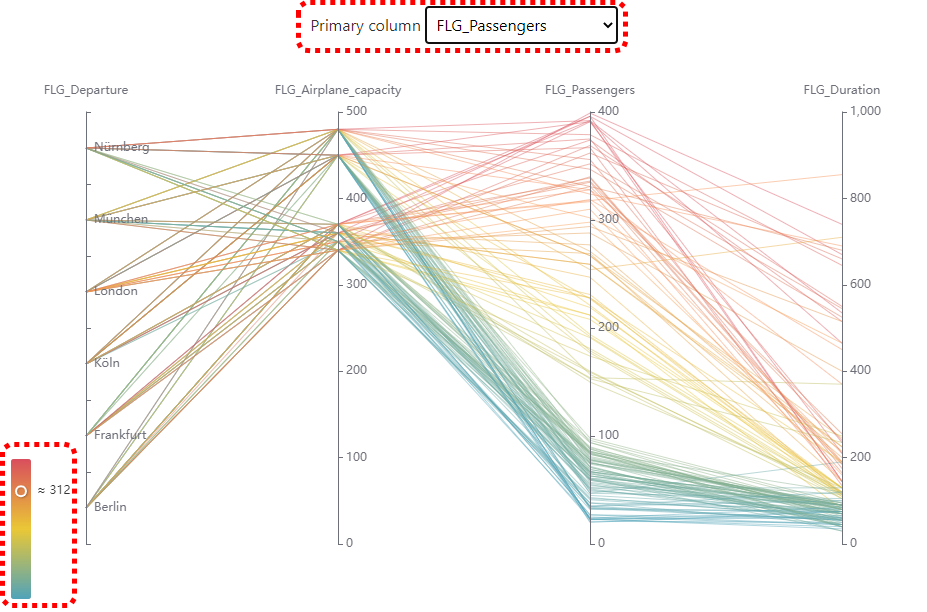
Figure 5 - Primary Column Selection and Data Visualization
By holding down the mouse and simultaneously dragging in the area of the parallel axes, a certain area of the axis can be marked and thus a filter can be created on this area (see Figure 6).
The data filtered out in this way are then displayed in gray. The marked area can also be moved along the axis with the mouse.
By creating multiple areas, the diagram can be modified interactively. Clicking on the Update button in the SimAssist main menu removes the areas added in this way.

Figure 6 - Select Range and Filter Data
Clicking on the axis headers changes the sorting of the axis labels (ascending/descending).
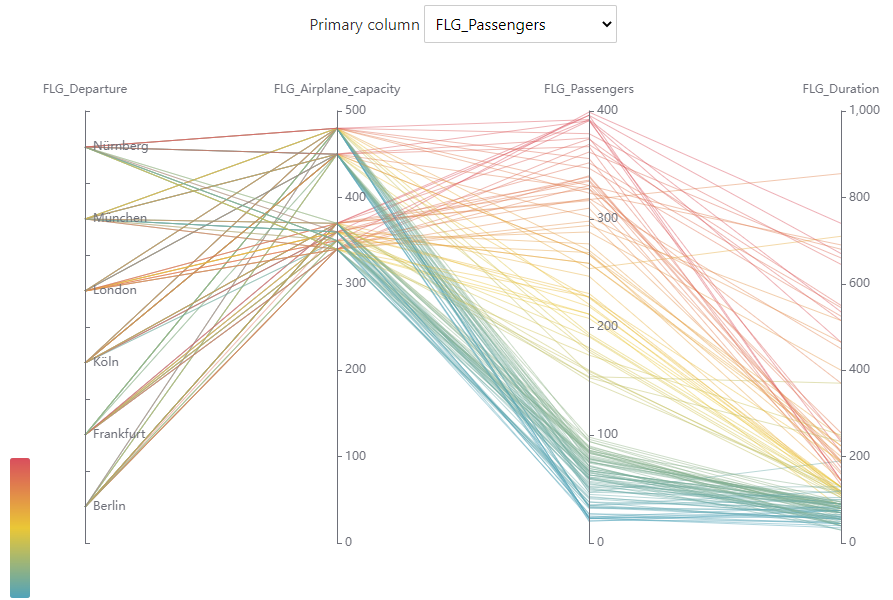
Figure 7 - Sorting in Ascending Order
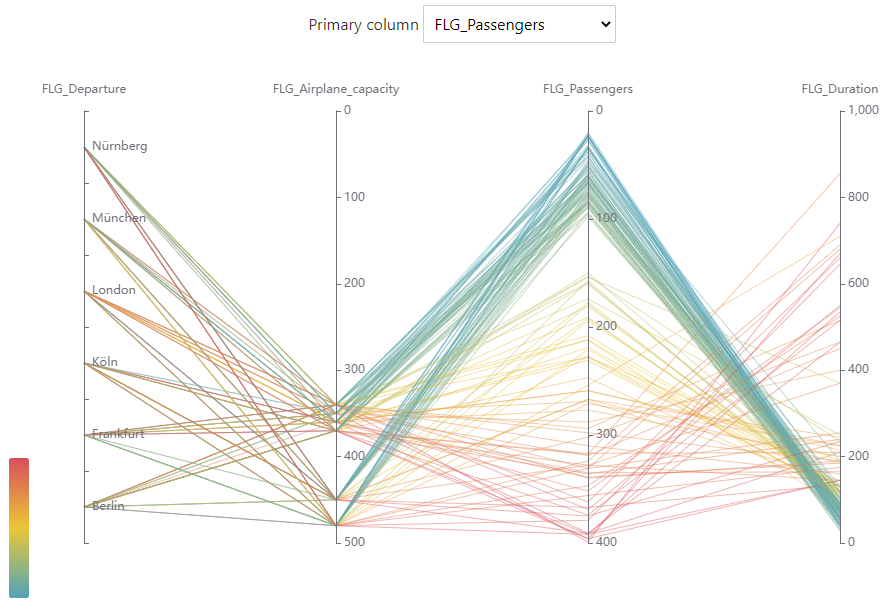
Figure 8 - Sorting in Descending Order for FLG_Airplane_capacity and FLG_Passengers
© SimPlan AG - Hanau District Court, Commercial Register (Part B) 6845 - info@simplan.de - www.simplan.de/en