The following comprises instructions for the SimGantt plug-in.
Contents
1. Introduction to the plug-in
1.3 Position in the Overall Software Package
2. Interface, Layout and Options
1. Introduction to the plug-in
The SimGantt plug-in enables you to create from your data dynamic Gantt charts, which are in particular useful for project management-related activities.
SimGantt automatically creates a detailed Gantt chart from the source data you added to the plug-in. You can freely determine the assignment of the Pivot Fields, depending on the table attached.
For detailed instructions on how to use the pivot elements, see the Pivot Chart section.
In order to keep the overview of the contents of the diagram at any time, you can zoom into the diagram with the mouse wheel.
You can also move the diagram on its X- and Y-axis by holding the left mouse button and moving the mouse.
1.3. Position in the Overall Software Package
The SimGantt plug-in is part of the 2view module, which also contains the SimChart, SimPie and SimVis plug-ins. SimGantt is available when you license the 2view module for SimAssist.
1.3.2. Links to Other plug-ins
The SimGantt plug-in is linked to a total of three other plug-ins.
The first plug-in it is linked to is the Database Definition plug-in, which acts as a data source, and therefore provides the data pool to be calculated for the distributions.
With the SQL Statements plug-in, the data pool can be individually specified using SQL queries. The Variables plug-in, which is also linked to SimGantt, works in a similar way.
2. Interface, Layout and Options
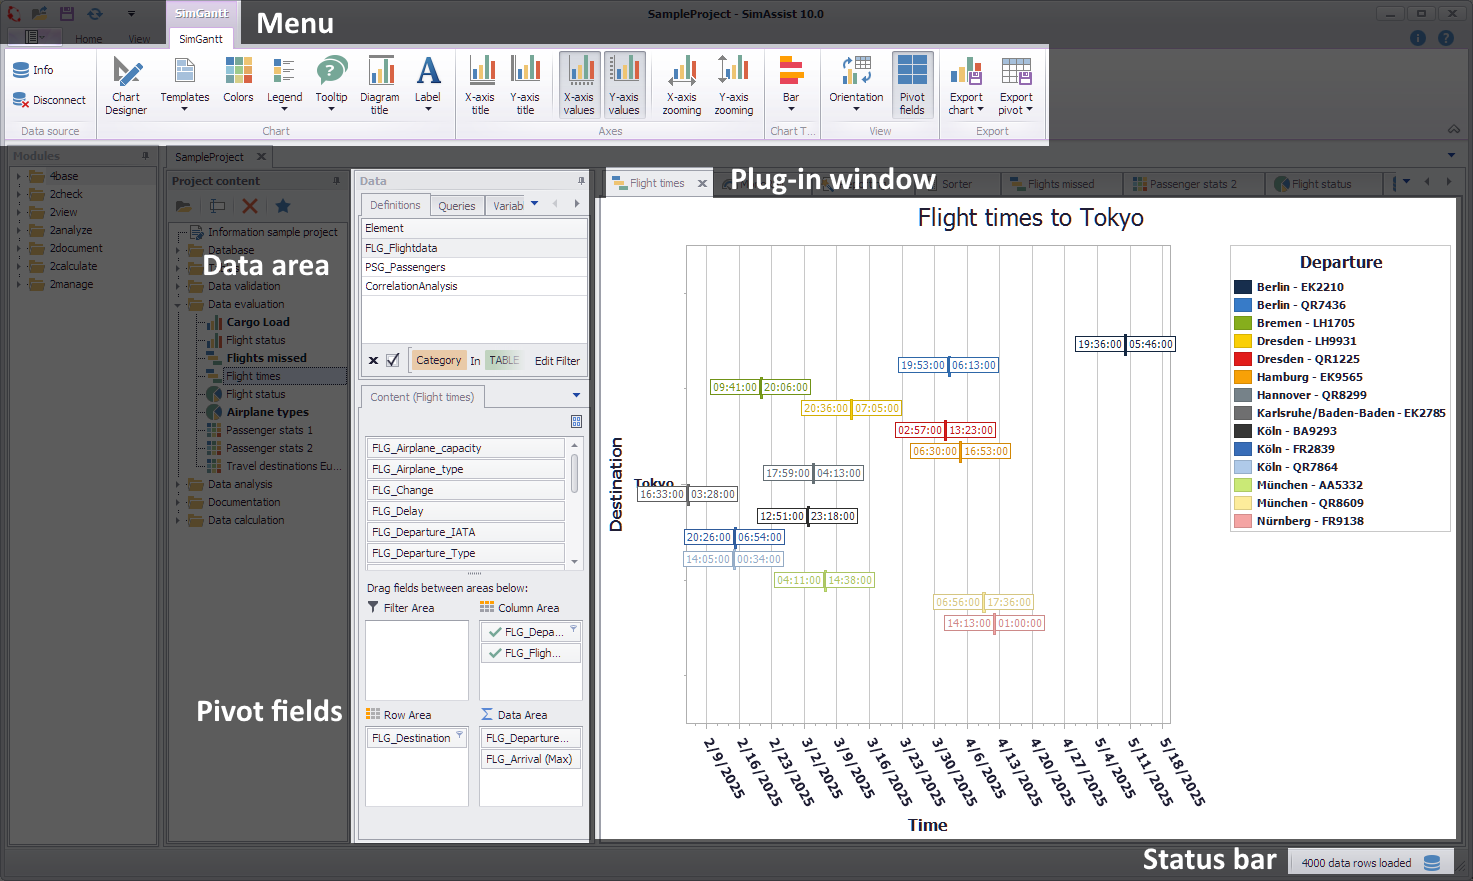
Figure 1 - Layout of the SimGantt plug-in
The SimGantt plug-in is divided into three areas (see Figure 1). The menu is located at the top. The exact function of the buttons located in the menu are explained in the chapter Pivot Chart.
In the right-hand section there is the data, that is connected to the plug-in and the Pivot Fields.
The dynamic Gantt diagram is displayed in the left area (working area). If you move the mouse over one entry, a pop-up with information about the respective bar appears.
Options
In the Options in the main menu of SimAssist you can make plug-in specific settings (see chapter Options). The following options are available for the SimGantt plug-in:
Option |
Description |
Diagram |
|
Show end value |
Specifies the default value whether the end value of an interval is shown or not. This is applied when a new plugin-in instance is created. |
X-axis zooming |
Specifies the default value whether zooming is allowed for the diagram's panes along their X-axes. This is applied when a new plugin-in instance is created. |
Y-axis zooming |
Specifies the default value whether zooming is allowed for the diagram's panes along their Y-axes. This is applied when a new plugin-in instance is created. |
Grouping |
|
Complement intervals |
Specifies whether missing intervals are complemented. |
Interval type |
Determines how numeric values or dates are assigned to a range. |
Maximum interval count |
Defines the maximum interval count that can be created by the grouping. |
Substring mode |
Sets the direction of the substring operation when grouping alphanumeric values. |
PivotChart |
|
Orientation |
Specifies the default orientation for new diagrams. This is applied when a new plug-in instance is created. |
Templates |
|
Default template |
This template is applied once when creating a new instance. |
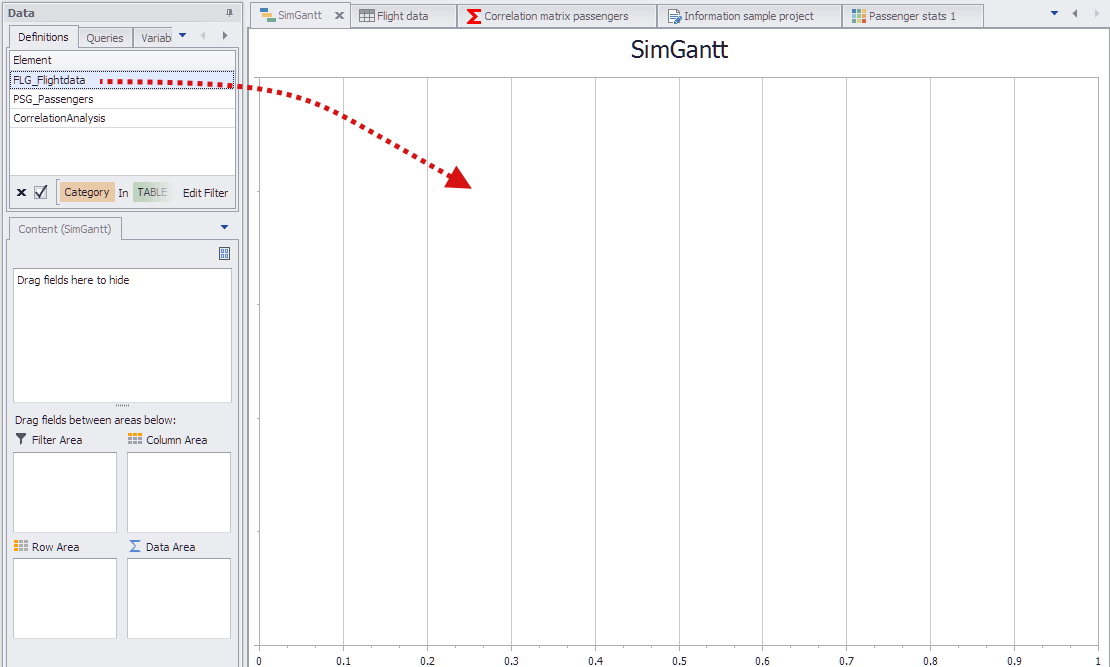
Figure 2 - Add data
To add data to the SimGantt plug-in, use the Drag&Drop function to move the desired data representation of a table into the working area (see Figure 2).
Then the columns of the table appear in the content area of the data area (see Figure 3) and can again be assigned to the underlying Pivot Fields using Drag&Drop.
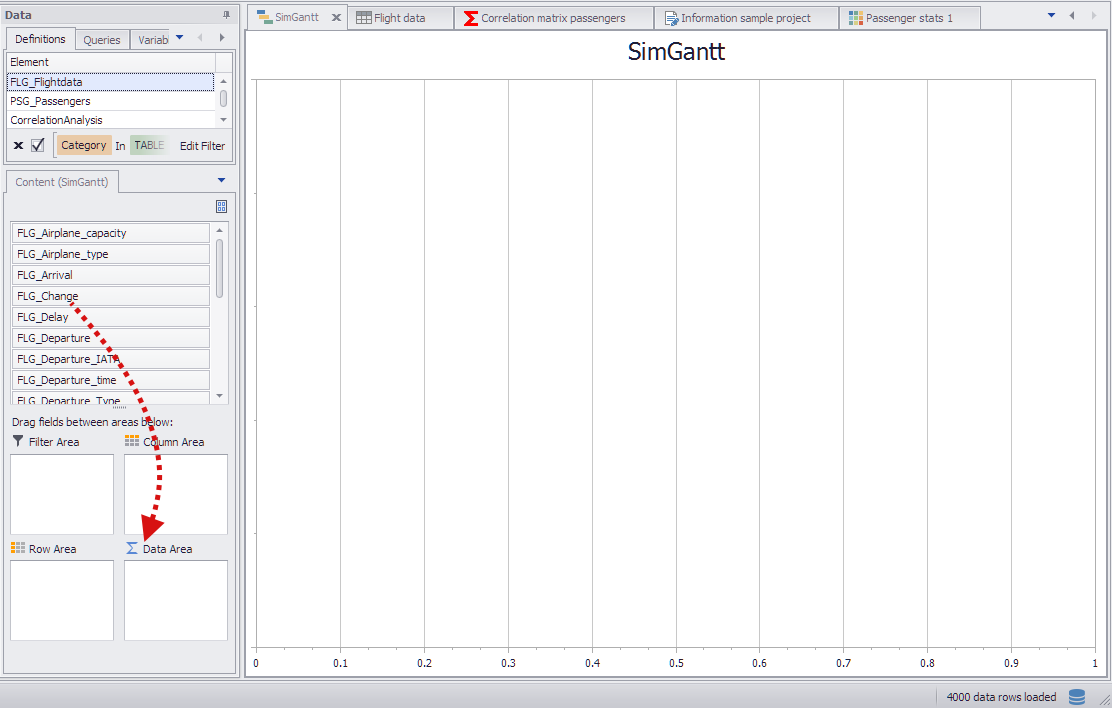
Figure 3 - Filled content area
|
Information: Starting with SimAssist version 7, a RowID column is automatically added. This column is numbered starting from 0 and can be used to draw a separate bar in the diagram for each data record in the database.
|
Once the data is connected to the plug-in, the Pivot Fields can be filled. Only DateTime values should be added to the Data Area of the Pivot Fields (in this case, starting- and landing times of airplanes).
In this case, the column added at first is included as the minimum, the other column is included as the maximum into the calculation of the Gantt diagram.
The data inserted into the Row Area of the Pivot Fields represents the Y-axis label in the diagram (in this example the flight number) (see Figure 4).
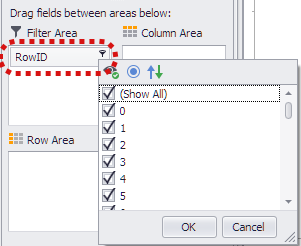
The data can be restricted using the filter icon in the Row Area (see Figure 5) (in this example for continents).
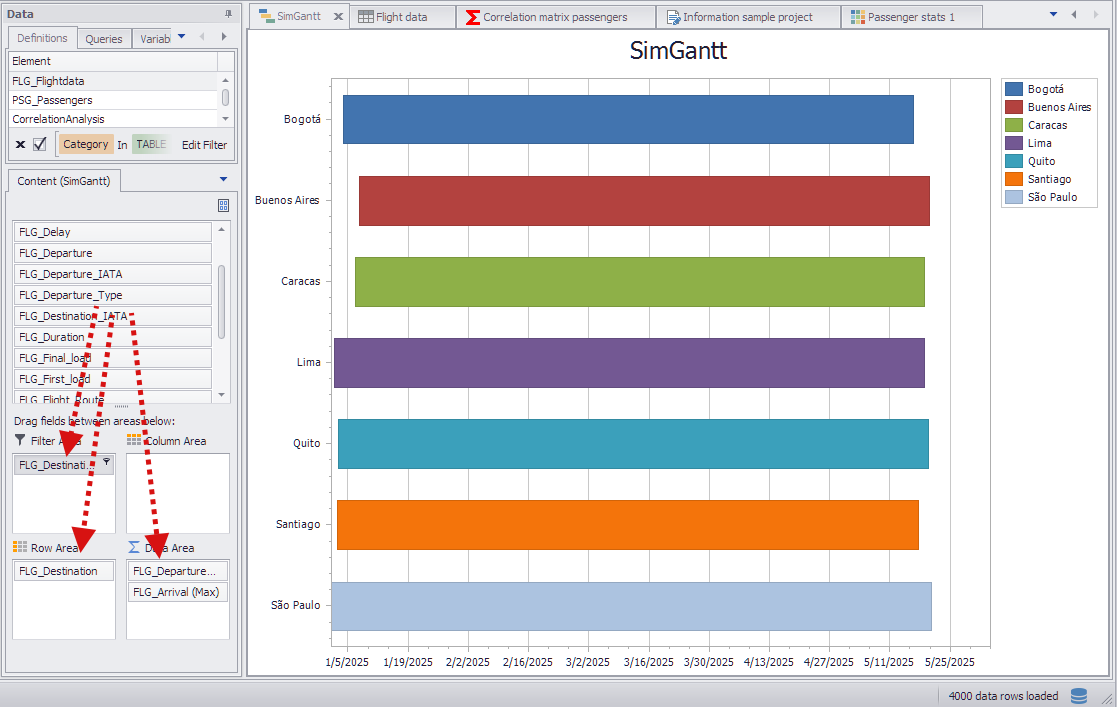
Figure 4 - Adding data
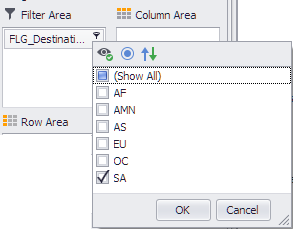
Figure 5 - Filtering data
Via the Column Area of the Pivot Fields, you can add further data to the Gantt diagram, thereby additionally influencing the coloring of the diagram.
Figure 6 shows the filtered flight numbers in the legend (compare Figure 4). Right-clicking on the contents of the Column Area displays the context menu of the column.
Here you can set a check mark by clicking on Colors.
This will adjust the colors of the bars to the contents of the column (FLG_Status is the status of the respective aircraft) and the legend changes (see Figure 7).
The representation in the workspace changes only in relation to the color of the bars. Thus another distinction criterion can be added to the Gantt diagram.
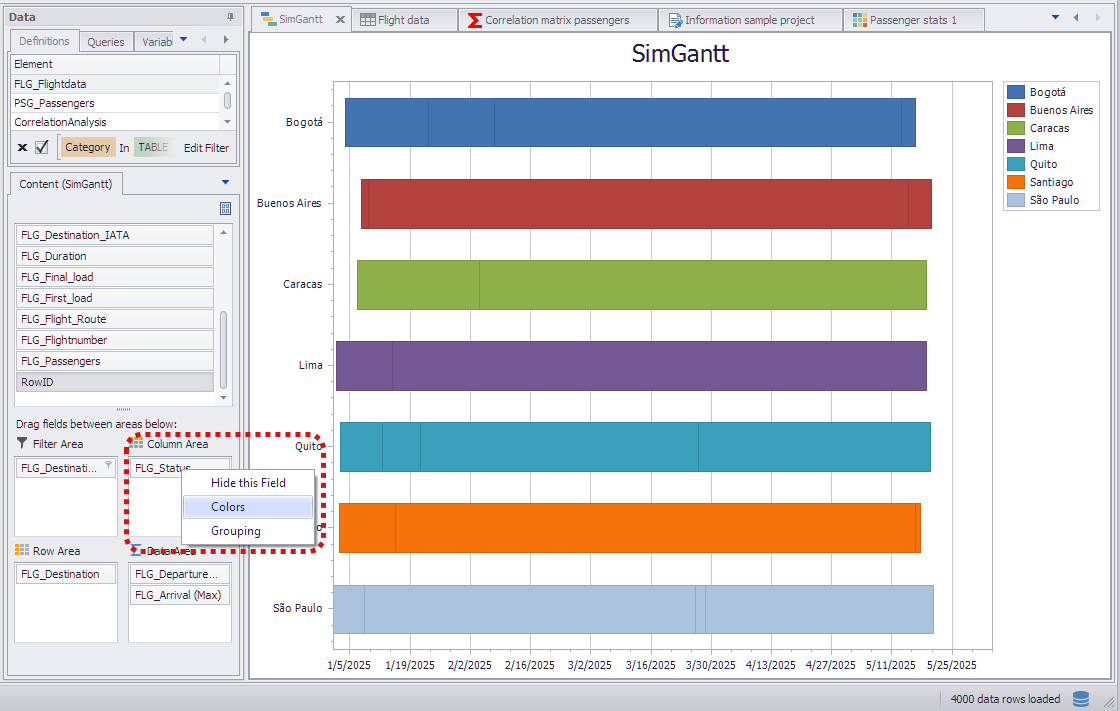
Figure 6 - Legend with values from the Y-axis
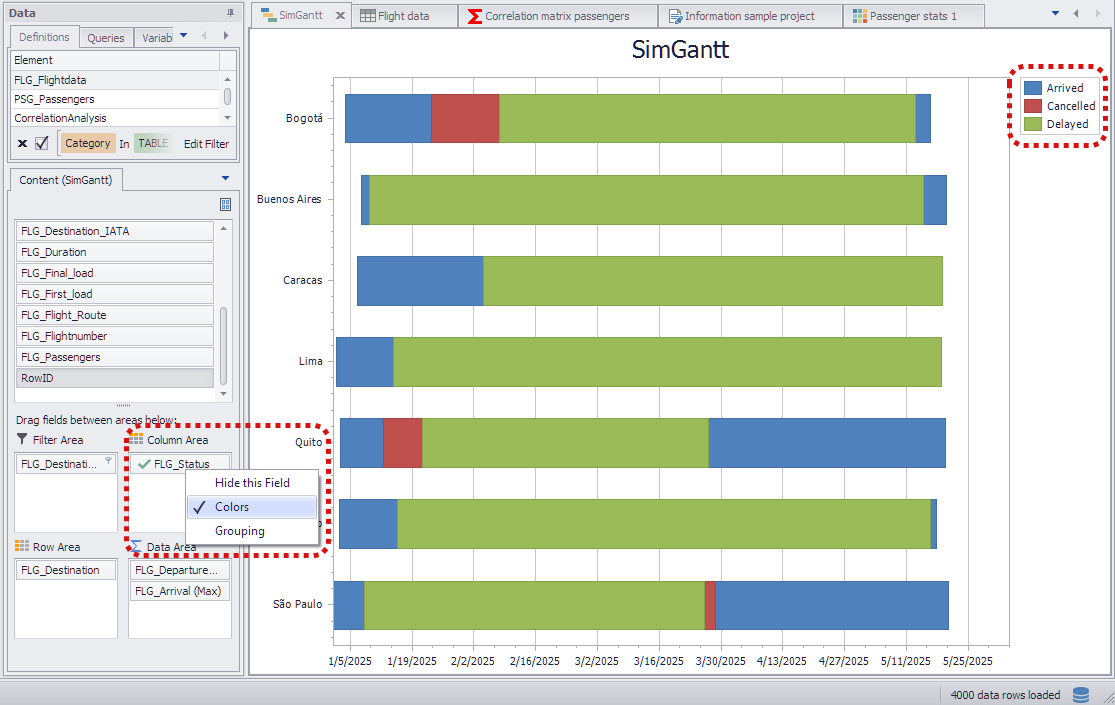
Figure 7 - Legend with values from the Column Area
Using the Gantt button (see Figure 8) two different display types can be selected for the Gantt diagram. The first option (default setting) displays the bars one line.
The second display option shows all the bars below each other. There is no overlapping of the bars, but they are displayed slightly thinner.
|
Information: In this view, overlapping is possible! |
Figure 8 - Gantt-Button |
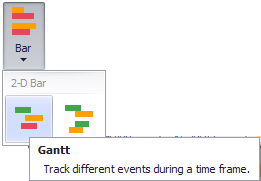
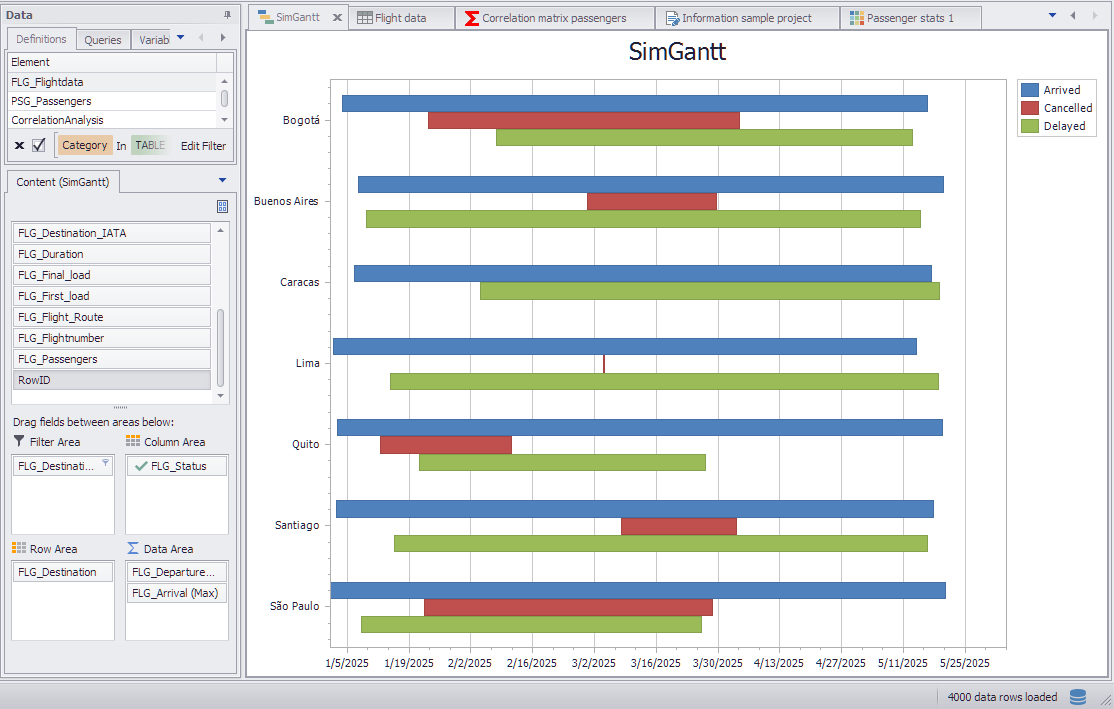
Figure 9 - Result
© SimPlan AG - Hanau District Court, Commercial Register (Part B) 6845 - info@simplan.de - www.simplan.de/en