The following comprises instructions for the Confidence Interval plug-in, as well as an example use case to provide more detailed step-by-step instructions.
Contents
1. Introduction to the plug-in
1.3 Position in the Overall Software Package
1. Introduction to the plug-in
The Confidence Interval plug-in enables you to generate a confidence interval for estimating the position of a parameter.
You can use the Confidence Interval plug-in to accurately estimate and calculate the position of the arithmetic mean. SimAssist therefore determines the following values:
•Standard deviation
•Variance
•Upper Limit
•Lower Limit
•Arithmetic mean
•Input length
In addition, the relevant data and results are clearly visualized in the form of a chart.
1.3. Position in the Overall Software Package
The Confidence Interval plug-in is part of the 2analyze module, which also contains the Categorization, Distribution Fitting, ABC Analysis and Correlation Matrix plug-ins.
Confidence Interval is available when you license the 2analyze module for SimAssist.
The Confidence Interval plug-in is linked to a total of three other plug-ins.
The first plug-in it is linked to is the Database Definition plug-in, which acts as a data source, and therefore provides the data pool to be calculated for the categorization.
With the SQL Statements plug-in, the data pool can be individually specified using SQL queries; this is also possible with the Variables plug-in.
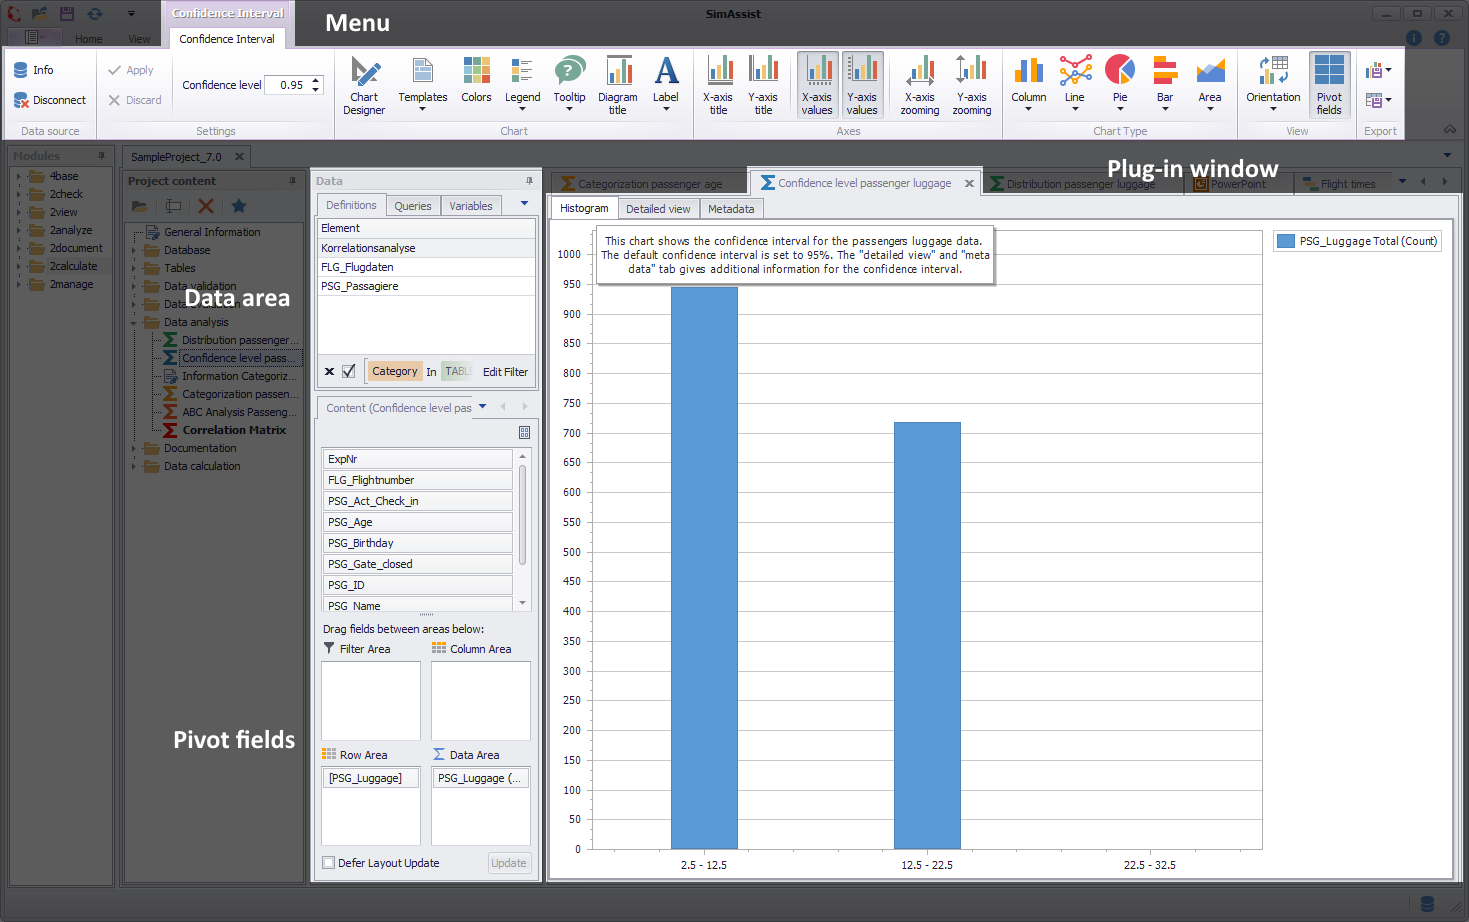
Figure 1 - Layout of the Confidence Interval plug-in
The plug-in confidence interval consists of a total of three different sections. First, you'll see the plug-in menu at the top, where the confidence level can be adjusted.
The data area in which the pivot table and the Pivot Fields are present is arranged below. Here, the data to serve as the basis for the calculation can be added to the plug-in.
For more detailed information, see the Pivot Fields chapter.
The largest part of the plug-in is the content area. This is divided into the three tabs Histogram, Detailed View and Metadata.
In the Confidence Interval plug-in menu, you can define a confidence level – the value of 0.95 typical for confidence intervals is entered here by default.
Use the two buttons to either apply or discard the changes.
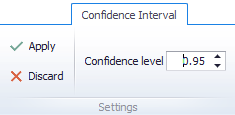
Figure 2 - Menu extract
All further buttons of the menu and their exact functioning can be read in the chapter Pivot Chart.
In the Options in the main menu of SimAssist you can make plug-in specific settings (see chapter Options). The following options are available for the Confidence Interval plug-in:
Option |
Description |
Diagram |
|
Show end value |
Specifies the default value whether the end value of an interval is shown or not. This is applied when a new plugin-in instance is created. |
X-axis zooming |
Specifies the default value whether zooming is allowed for the diagram's panes along their X-axes. This is applied when a new plugin-in instance is created. |
Y-axis zooming |
Specifies the default value whether zooming is allowed for the diagram's panes along their Y-axes. This is applied when a new plugin-in instance is created. |
Grouping |
|
Complement intervals |
Specifies whether missing intervals are complemented. |
Interval type |
Determines how numeric values or dates are assigned to a range. |
Maximum interval count |
Defines the maximum interval count that can be created by the grouping. |
Substring mode |
Sets the direction of the substring operation when grouping alphanumeric values. |
PivotChart |
|
Orientation |
Specifies the default orientation for new diagrams. This is applied when a new plug-in instance is created. |
Templates |
|
Default template |
This template is applied once when creating a new instance. |
As the Confidence Interval plug-in is used for interval calculation purposes, only numerical values can be added in the Data Source area.
To add data to the Confidence Interval plug-in, move the desired data representations, such as a table column, from the definitions tab of the data area into the plug-in window.
After that, the column(s) are displayed in the pivot table. Out of this list, the desired column can be dragged into the content area of the plug-in.
The calculation of the confidence interval will now start automatically (see figure 3).
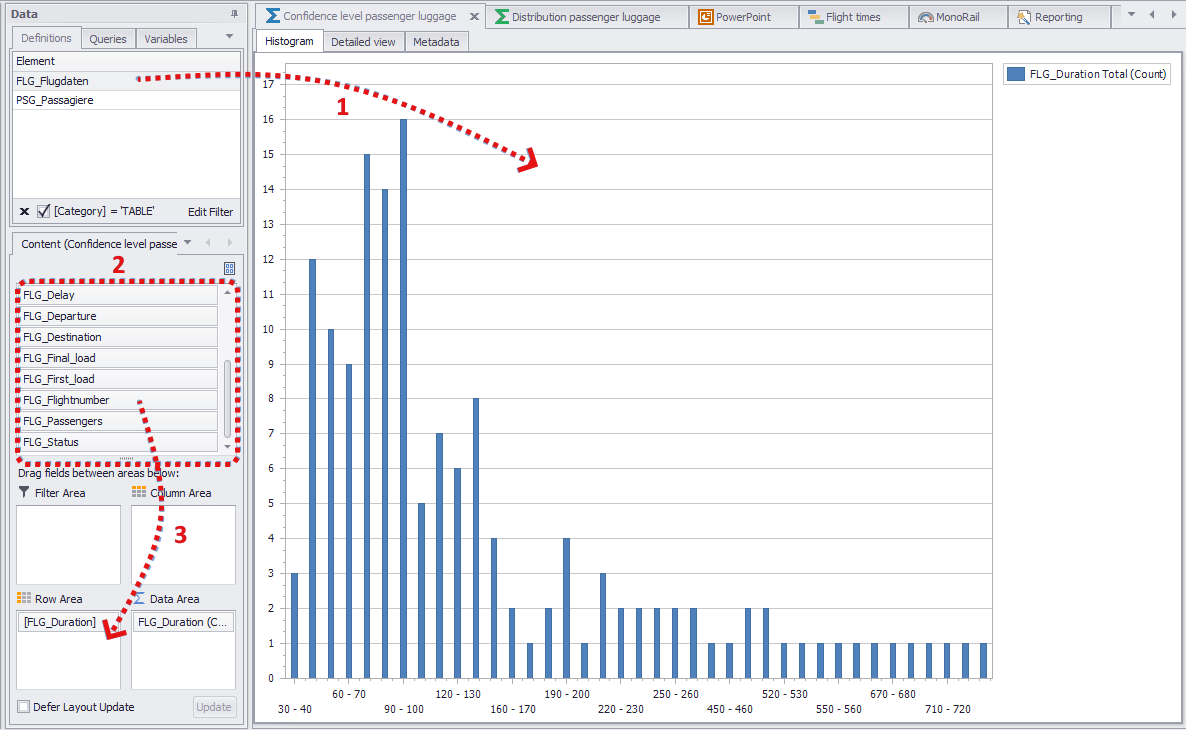
Figure 3 - Adding data
1.The first step when using the plug-in is to specify the desired confidence level in the menu.
2.To do so, either manually enter a value up to a maximum of 1.0 or use the arrow icons to the right of the field to configure the desired value in increments of 0.01.
3.You then need to add data to the plug-in (see Data sources).
4.The confidence interval is generated automatically when you add data to the plug-in.
Once the confidence interval has been calculated, a visualization is generated in the form of a chart.
In the Histogram Tab a histogram and its legend are displayed. In addition, further information is displayed when you move the mouse pointer over the individual bars of the histogram.

Figure 4 - Histogram
The Detailed view tab shows the Confidence Interval, Variance, Count and Standard deviation graphically.

Figure 5 - Detailed view
The Meta data Tab shows the following data (see figure 6).
The data shown here refers to the (entire) raw data, not the filtered data in the diagram.
•Field Name •Standard deviation •Variance •Upper Limit •Lower Limit •Arithmetic Average •Count |
Figure 6 - Meta data |

© SimPlan AG - Hanau District Court, Commercial Register (Part B) 6845 - info@simplan.de - www.simplan.de/en