In the status bar, information about the loading progress of individual plug-ins or the entire project is displayed.
![]()
It shows the loading progress and also the number of rows already loaded from the database. The status bar is at the bottom of each window.
At the right edge of the status bar, information about the currently connected database can be called up via the blue database icon ![]() .
.
When you hover over the icon, an info pop-up appears with detailed info about the connected data source.
Clicking on the icon opens the database information window, which again displays details about the connected data source. Details about this window can be found in the Pivot Chart chapter.
It shows that data is being loaded in the background and also displays the number of rows already loaded from the database. The status bar is located at the bottom of the respective window.
If a plug-in or project is detached using the docking function, the new window also contains a status bar. As soon as the plug-in windows are “docked” again, their status bars are also merged.
If plug-ins or projects are arranged side by side in the frame application, each project has its own status bar (see Figure 2).
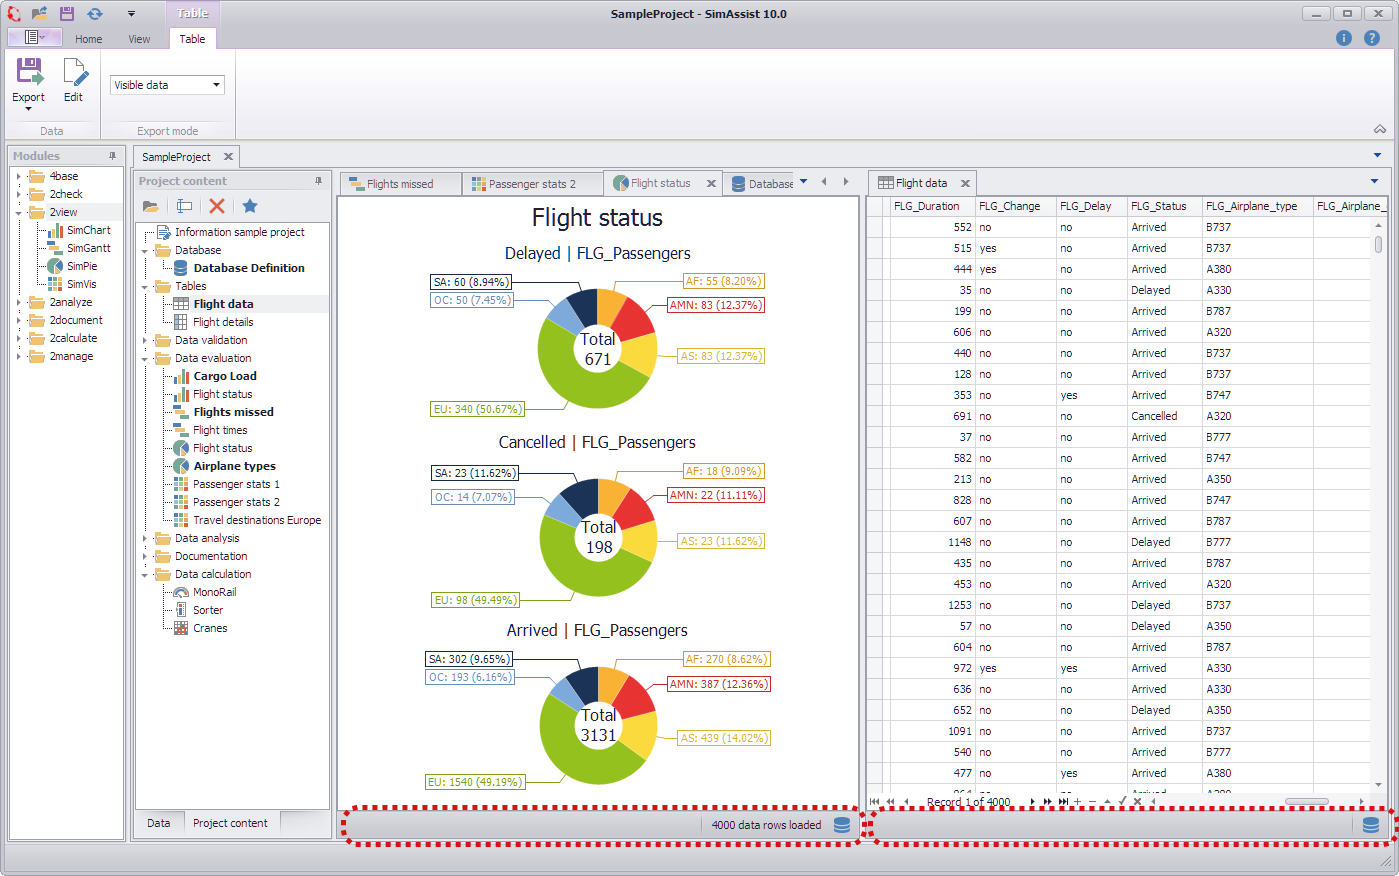
Figure 2 - Window arranged side by side
© SimPlan AG - Hanau District Court, Commercial Register (Part B) 6845 - info@simplan.de - www.simplan.de/en