Below you will find the instructions for the SimTarget plug-in.
The SimTarget plug-in normalizes parameters and performance indicators within their value range and calculates a target function value from this.
Various weightings of the individual parameters and performance indicators are taken into account in the target function.
The constellations of influencing variables can be sorted and highlighted in color based on the target function value.
Contents
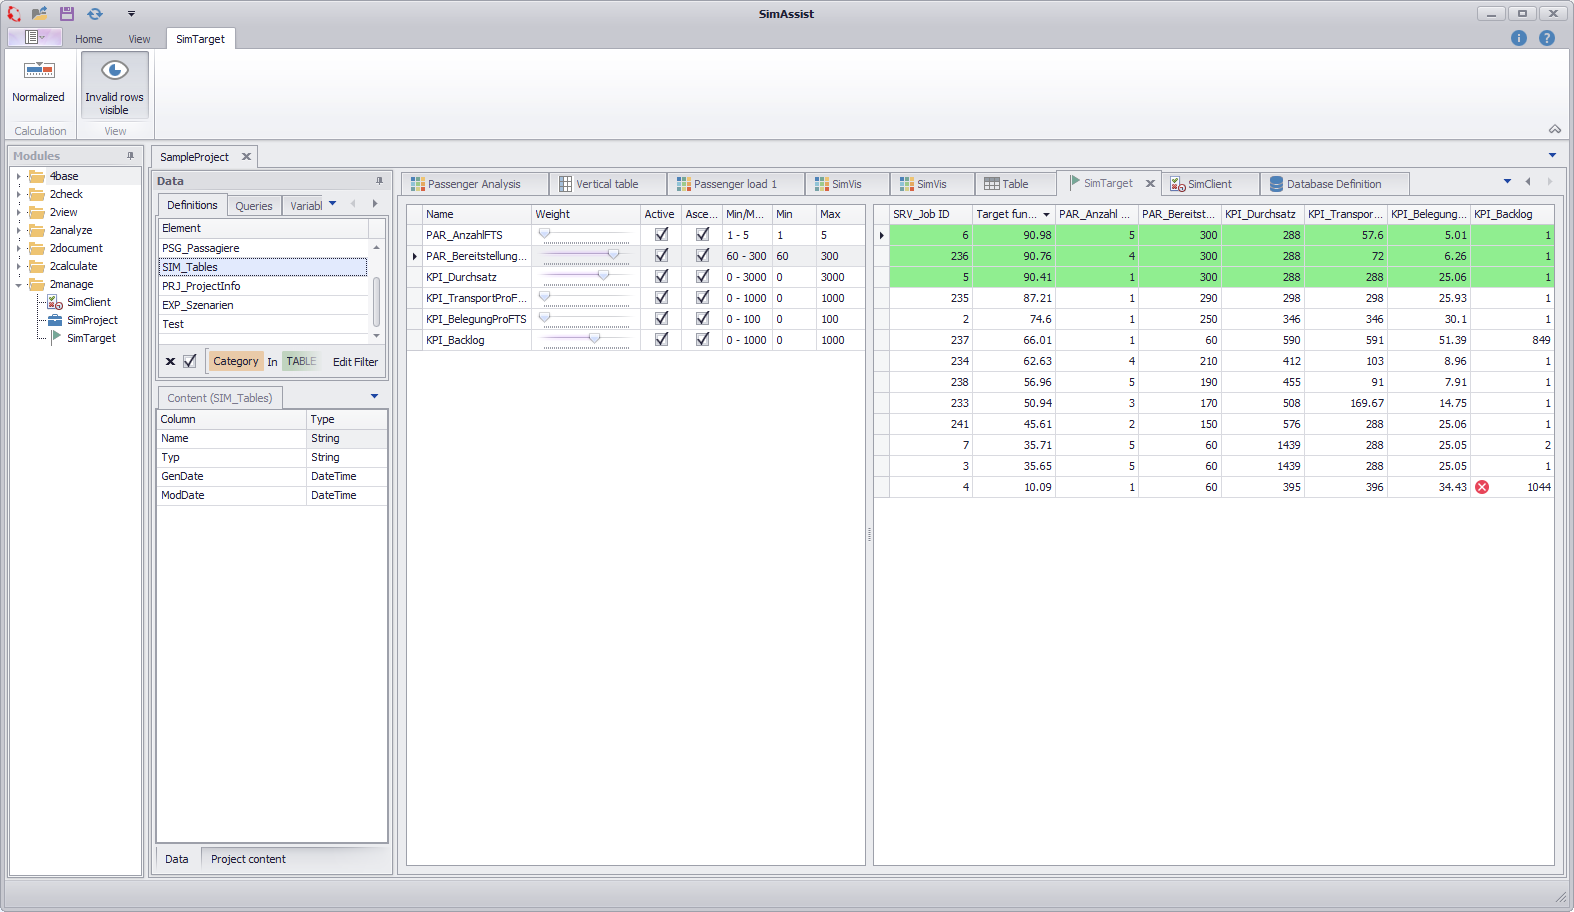
Figure 1 - Overview
The structure of the plug-in is divided into three parts: Menu, parameters and results table. The individual areas are briefly explained below.
Button |
Description |
|
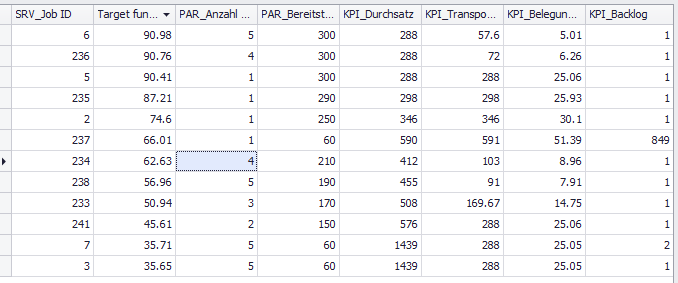
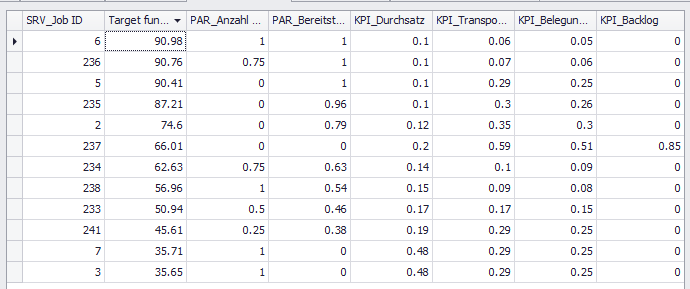
Using the Normalized button, parameter values can be normalized between 0 and 1 with one click, as shown in Figures 2 and 3.
Figure 2 - Results table
Figure 3 - Normalized results table |
|
The automatic recalculation of the target function values after a change to the setting (weight, min/max range, normalization) can be deactivated via the global options. An additional Recalculate button is then displayed, which can be used to start a manual calculation. This option is particularly useful for large amounts of data with a longer calculation time. |


The basis for using SimTarget is the SimClient plug-in, which is used as the data source. The results of the experiments carried out with SimClient are used in SimTarget.
As soon as the data has been connected, all available parameters and KPIs are listed one below the other. The available columns from Figure 4 are listed and explained below:
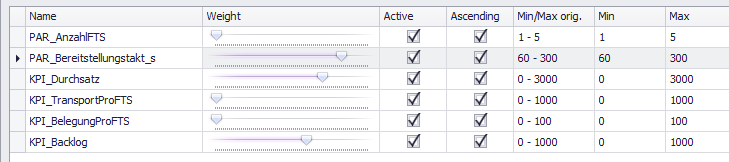
Figure 4 - Parameters
Name |
Description |
||||
Name |
Name of the parameter or KPI from the database |
||||
Weight |
The slider in the Weight column can be used to set a weighting of the respective parameter/KPI between 0 and 100. If a weighting factor is set to the value "0" using the slider, the name of the parameter/KPI is also grayed out. Changes to the weighting factor are automatically applied and the results table is automatically updated. |
||||
Active |
Individual entries can be activated/deactivated via the Active check box. |
||||
Ascending |
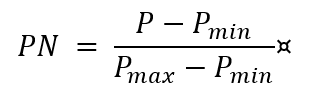
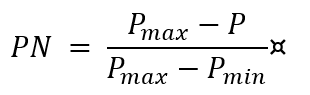
A parameter is marked as Ascending (check box active) if its increase is positively included in the calculation of the target function value. Conversely, the increase of a non-increasing parameter is included negatively in the target function. The property influences the calculation of the normalization of a parameter PN from the parameter value P and the minimum and maximum values (Pmin, Pmax) of the parameter, as equations 1 and 2 show:
|
||||
Min/Max orig. |
The respective min/max value from the settings in the database. This cannot be changed. |
||||
Min/Max |
Initially the minimum or maximum value from the database for the respective parameter/KPI. This can be adjusted by user input. If the value in the results falls below or exceeds a value due to the adjustment of the value, this is indicated by an These changes are also applied automatically and the results table is updated automatically. If the user does not enter a min/max value, the smallest and largest value that actually occurs is automatically set as the limit. |
Complete results of the calculations as well as the ServerJobID and the Target function value are displayed in a table.
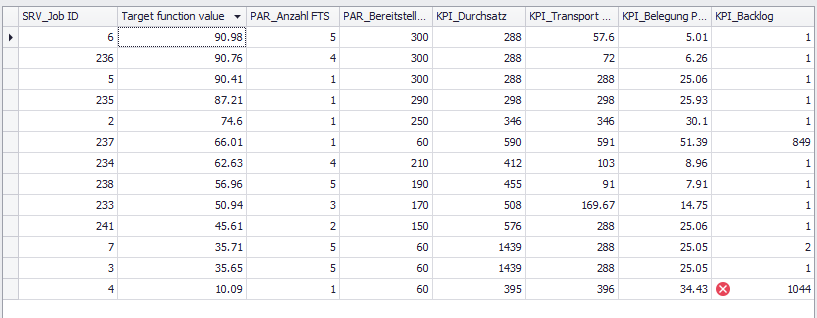
Figure 5 - Results table
By default, the table is sorted in descending order according to the Target function value column.
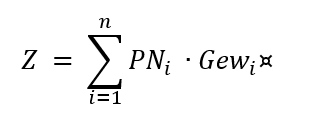
The target function value Z is calculated from the normalized parameters/KPIs PNi and the associated weights Gewi using the following equation:
All numerical values are automatically displayed with two decimal places, whereby this display can be adjusted via the context menu of the respective column via the Number of decimal places item.
In addition, rules can be defined via the Conditional formatting item in the context menu of the columns, according to which the respective cells of the columns are to be colored.
The Extended conditional formatting option is available via the context menu of the Target function value column. The dialog can be used to quickly format the results table.
The deviation from the maximum value can be specified as a number as well as the color to be used for marking the table (see figures below).
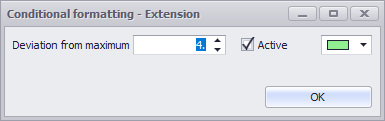
Figure 6 - Advanced conditional formatting
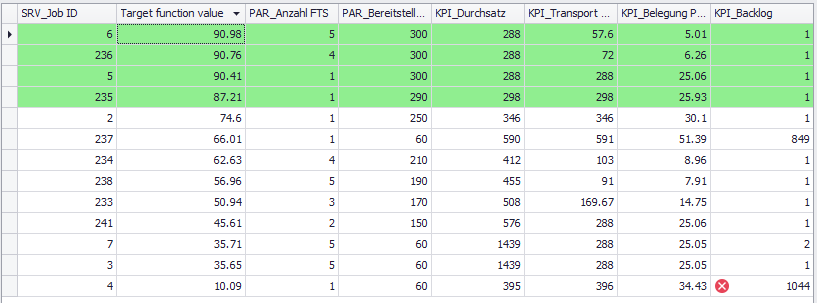
Figure 7 - Formatted results table
The following figure shows the global options. The Auto-calculation option can be activated or deactivated there.
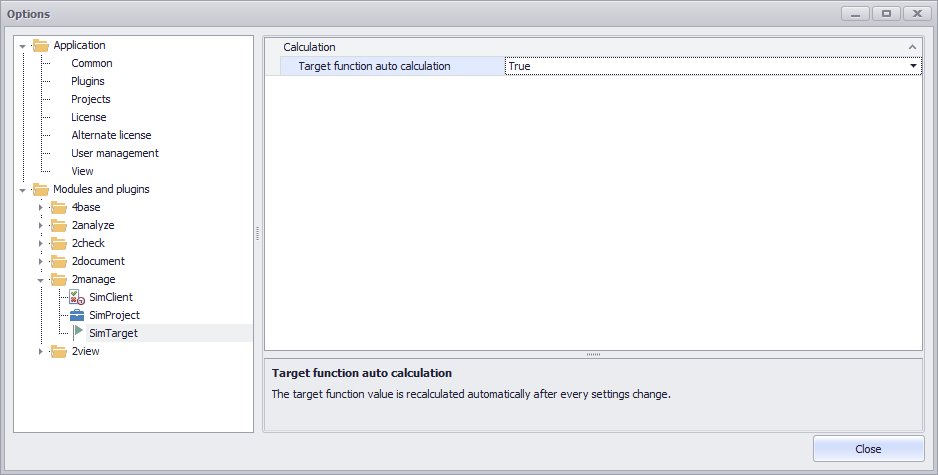
Figure 8 - Global options
The basis for using SimTarget is the SimClient plug-in, which is connected and used as a data source via Drag&Drop. The results of the experiments carried out with SimClient are used in SimTarget.

Figure 9 - Data connection
© SimPlan AG - Hanau District Court, Commercial Register (Part B) 6845 - info@simplan.de - www.simplan.de/en