This chapter shows and explains how to use the Multi Chart setting.
Contents
Since SimAssist version 4.0 it is possible to create Multi Charts. This functionality is available in the plug-in SimChart.
As soon as an element is present in the column area of the pivot fields, the Multi Chart functionality can be activated via the context menu of this column (right click on the element) (see Figure 1 and 2).

Figure 1 - Column Distribution
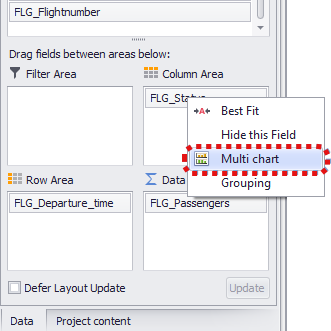
Figure 2 - Context Menu Multi Chart
The charts are drawn on the basis of the content of the respective element. The column FLG_Status contains the entries Anflug, Gelandet and Gepäckausgabe.
For each of these entries, a separate chart is created by activating the functionality (see Figure 3).
|
Note Starting with SimAssist version 10.1, an additional button appears in the menu that allows you to quickly adjust the layout of the Multi-chart (see the figures on the right). Selecting the “Balanced chart sizes” check box fills in “odd” layouts with empty charts so that all charts are the same size. |
|
|
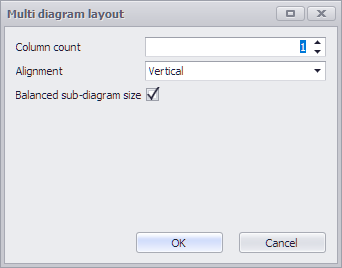

Figure 3 - Multi Chart created
For display and arrangement there are various options which can be configured in the Chart Designer.
The following figures show an example of how the newly created charts can be arranged in different ways.
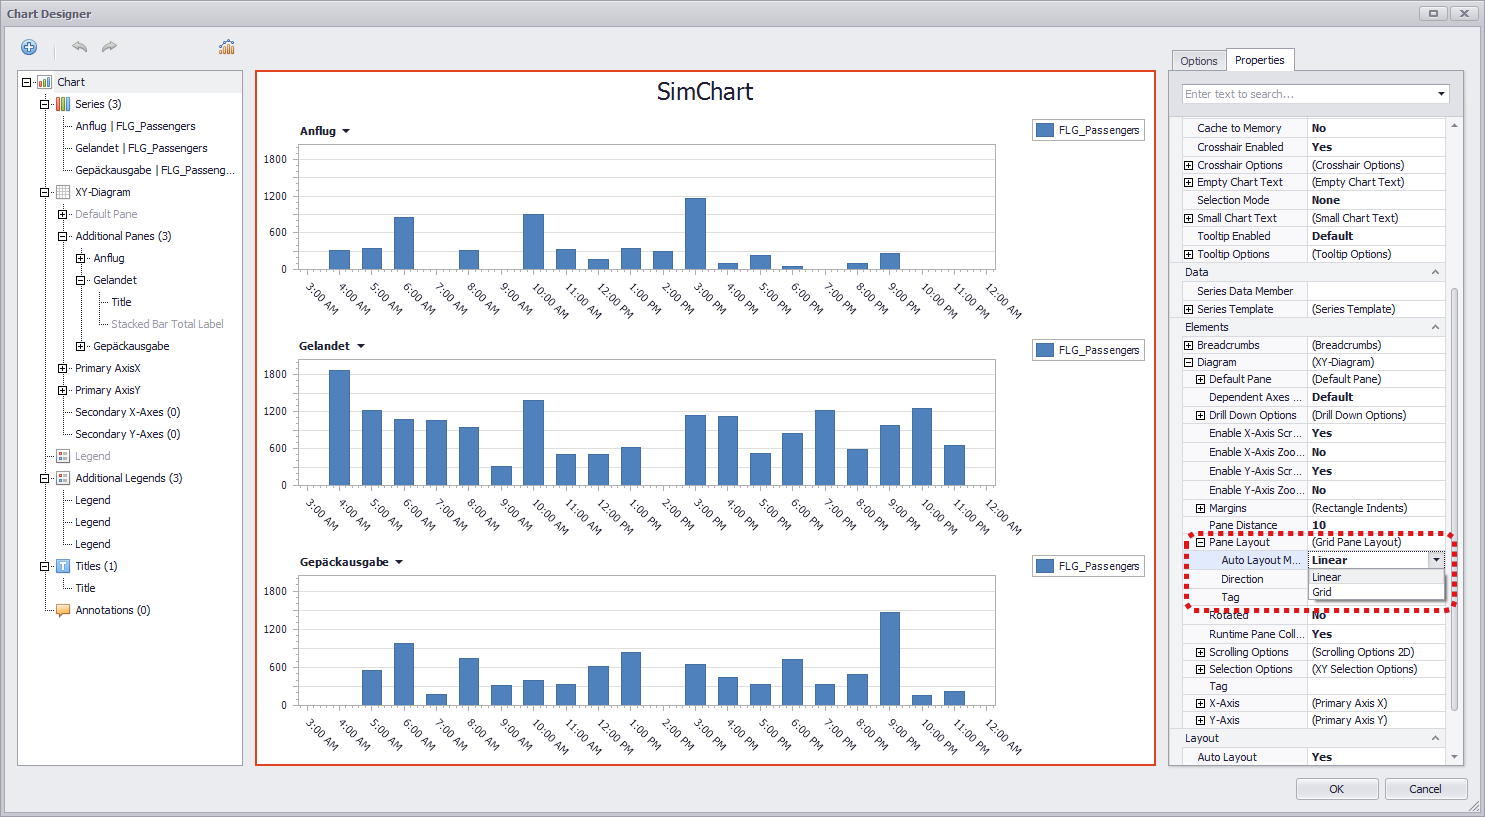
Figure 4 - Auto Layout Mode: Linear
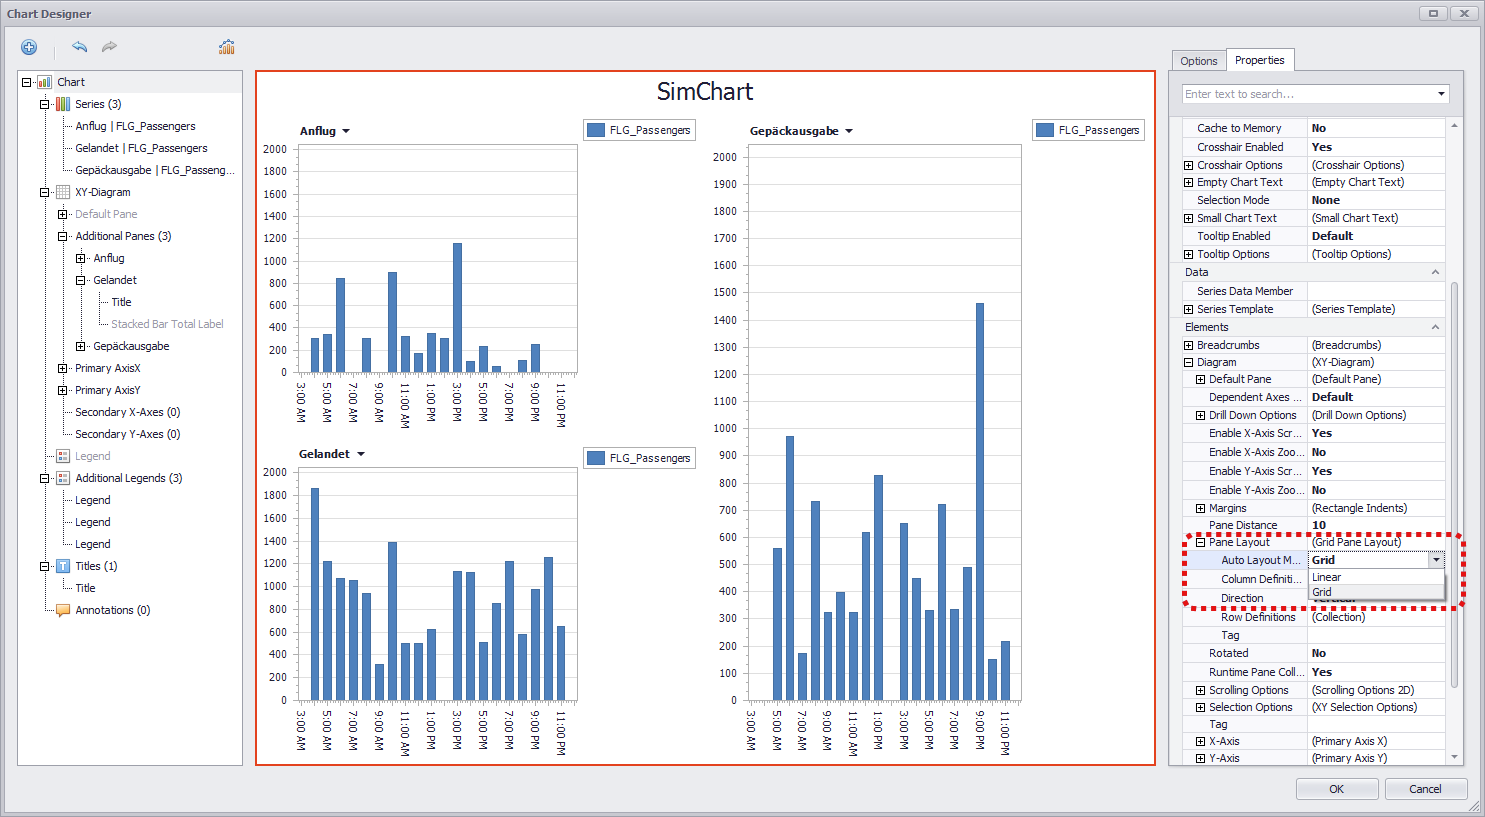
Figure 5 - Auto Layout Mode: Grid
An additional feature that has been added by the use of Multi Charts is the ability to use different chart types in one chart.
This is also possible without activating the Multi Chart. The following example shows a simple chart, with two columns in the data area of the pivot fields (see Figure 6).
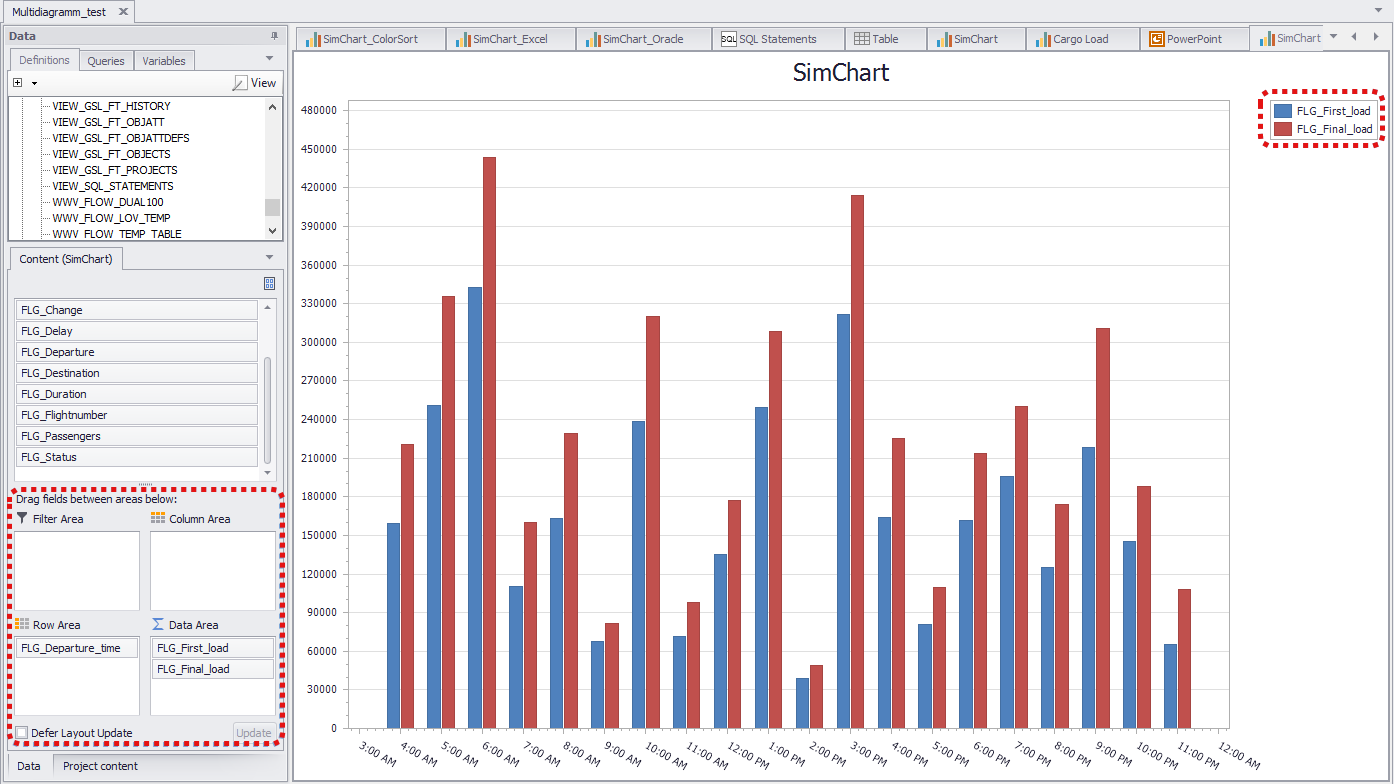
Figure 6 - Column Distribution
Afterwards the desired series can be marked via the Chart Designer on the left side in the area Series (also possible via direct selection by clicking on the desired element in the middle).
The desired display form can be selected via the drop down of the point View.
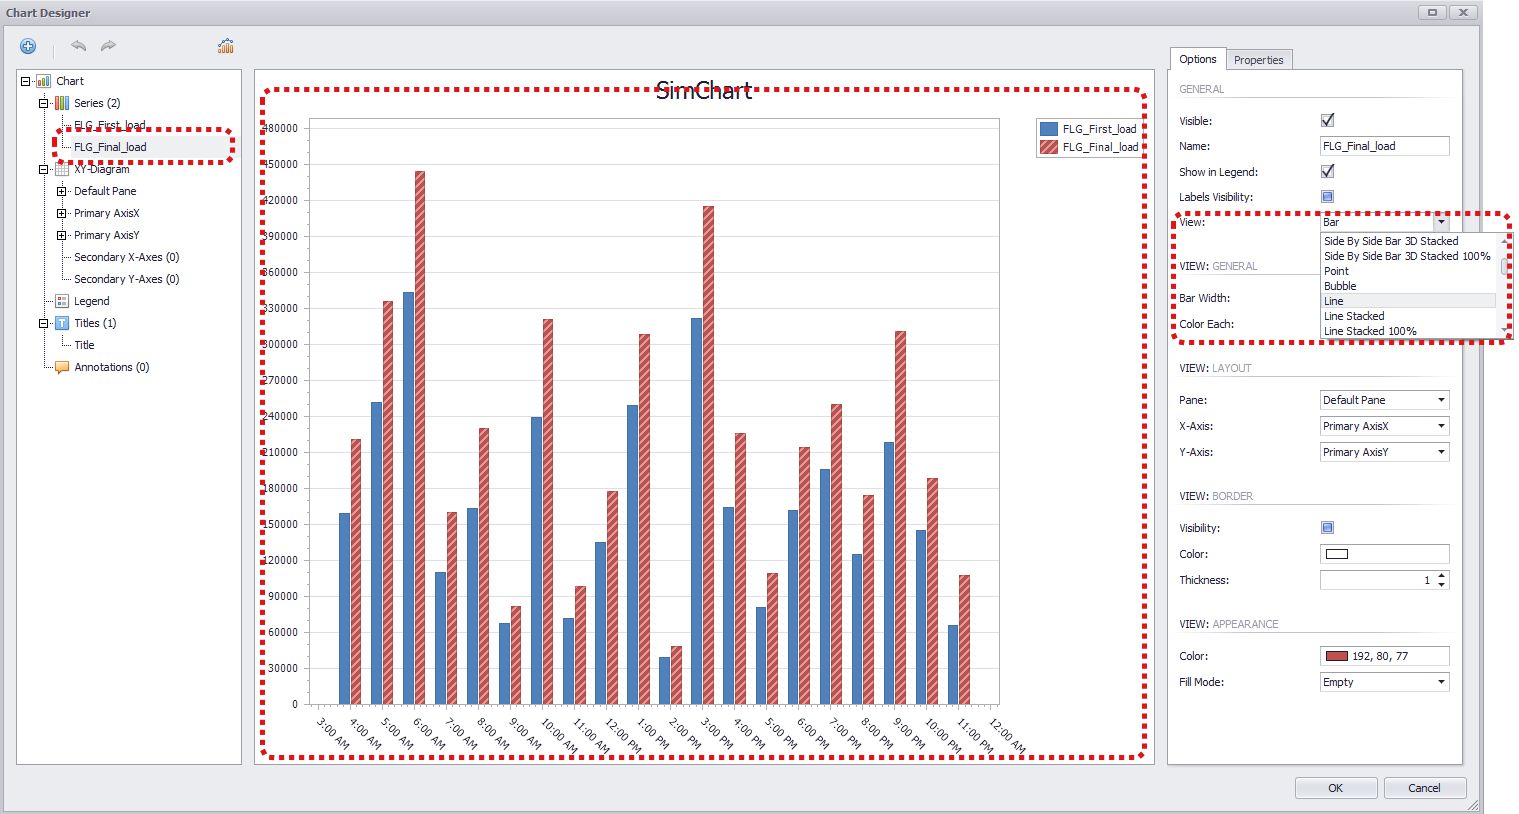
Figure 7 - Select Series
The changes are accepted by clicking on OK and the new chart with different chart types is displayed in the plug-in.

Figure 8 - Result with Different chart types
© SimPlan AG - Hanau District Court, Commercial Register (Part B) 6845 - info@simplan.de - www.simplan.de/en