Contents
The following lists the buttons from the menu and explains how they work:
Button |
Description |
|
The button Show modified variables only serves as a quick filter for the view in the Design tab. If the button is activated, only variables that have been manually adjusted by the user are displayed in the Design area. |
|
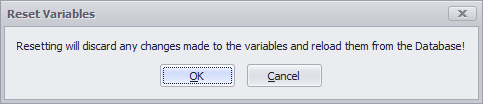
The Reset button resets all changes made manually by the user and restores the initial state from the database. The reset must be confirmed via the following dialog:
|

To add data to the plug-in, it is enough to Drag&Drop the required table from the Data Area to the plug-in window.

Figure 1 - Adding Data
Then all the columns contained in the table will be listed; different views can be created using the grouping function (context menu) (see Figures 2 - 4).

Figure 2 - Data added
Figure 3 - Activate Grouping |
Figure 4 - Grouping Result |

The arrangement as well as the parametrization of the columns must be defined in the database. The ProjectInfo table contains the following defined structure:

Figure 5 - Table ProjectInfo
The following table is used to explain the entries of the ProjectInfo table:
Value |
Description |
Exp Nr |
The value for the experiment number in this table must always be "1". |
Modelname |
Name of the model |
Modeltype |
Type of the model (will be transferred to the model during experiment execution) |
Simulator |
Simulation software, which is used for the execution of the experiments (is transferred to the model at experiment execution) |
Version |
Version of the simulation software, which is used for the execution of the experiments |
XML_File |
XML file defining the structure, data types, default values, ranges (incl. range limits), categories and prioritization |
SimClient |
XML file with values entered by the user for the experiment parametrization via the user interface. |
Gendate |
Last modification date of the database |
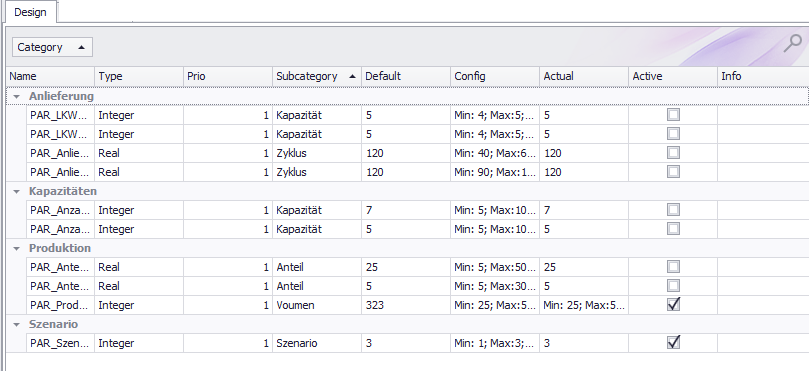
In the following the available columns are listed and explained as an example. The order or view of the columns can be adjusted as desired, for example by grouping or filtering.
Value |
Description |
Name |
Shows the name of the column from the connected table/database. |
Category |
Shows the categories defined in the configuration file (XML) |
Type |
Shows the data types defined in the configuration file (XML) |
Prio |
Shows the priorities defined in the configuration file (XML), according to which the experiments are to be performed |
Subcategory |
Shows the subcategories defined in the configuration file (XML) |
Default |
Shows the default setting / values as defined in the configuration file (XML) |
Actual |
Shows the properties as parametrized by the user |
Config |
Shows the properties as defined in the configuration file (XML) |
Active |
The respective line can be activated/deactivated by setting/removing the check mark. If the check mark is set, the properties can be parametrized and the line is taken into account during experiment generation. |
Info |
Additional information can be displayed in the Info column. |
Variables can be parametrized in the Properties area. The parametrization possibilities, as well as default values and allowed values are defined in the XML file in the database.
In general, a distinction can be made between the two possibilities of dividing values into a range or into discrete values:
Type Range:
With the option to specify values in a specific range, this must be defined in the input mask from the following figure.
The Min/Max fields define the lower and upper limits of the values, the Step field defines the step size.
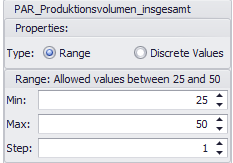
Figure 6 - Range
Discrete values type:
With the option to define values as Discrete Values, they can be specified per line, as shown in the figure below.
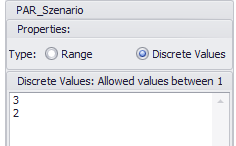
Figure 7 - Discrete Values
© SimPlan AG - Hanau District Court, Commercial Register (Part B) 6845 - info@simplan.de - www.simplan.de/en