Below you will find the instructions for the Correlation Matrix plug-in as well as an exemplary use case in a detailed step-by-step tutorial.
Contents
1. Introduction to the plug-in
1.3 Position in the Overall Software Package
3.2 Selection of matrix columns
1. Introduction to the plug-in
Definition
In stochastics, the correlation matrix is a symmetric and positive semidefinite matrix that captures the correlation between the components of a random vector.
The correlation matrix can be obtained from the variance-covariance matrix and vice versa.
The correlation matrix as a matrix of all pairwise correlation coefficients of the elements of a random vector ![]() contains information about the correlations between its components:
contains information about the correlations between its components:
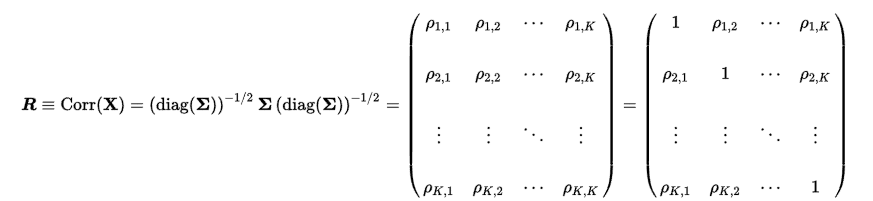
with the (product-moment) correlation coefficients |
|
and the variance-covariance matrix |
|
Properties
If all components of the random vector |
|
are linearly independent, then |
|
is defined positively. |
The correlation of the variables with themselves is calculated on the main diagonal. Since the correlation of the quantities is strictly linear, the correlation on the main diagonal is always 1.
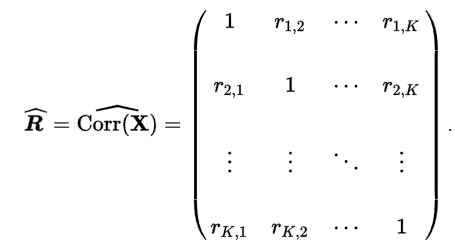
Estimate
An estimate of the correlation matrix is obtained by using the empirical correlation coefficients.
The plug-in displays the data of a correlation analysis graphically. The selection of the matrix columns can be defined by the user and the graphical representation can be formatted afterwards.
|
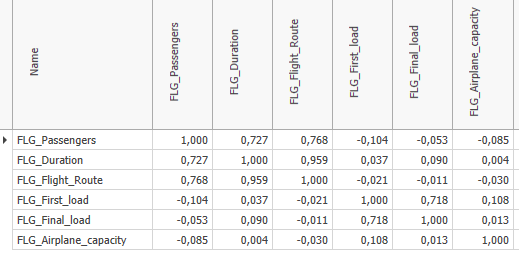
Attention In order to work with the plug-in, the data source used must be in the appropriate format. Figure 1 shows such a table. |
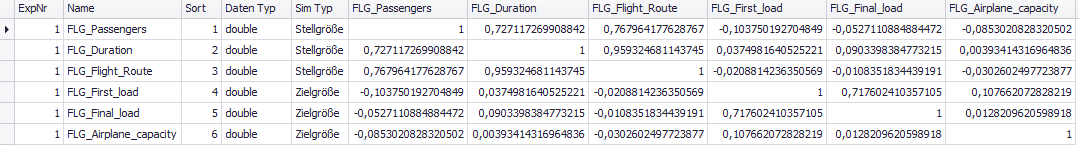
Figure 1 - Correlation Analysis Table
1.3 Position in the Overall Software Package
The Correlation Matrix plug-in is part of the 2analyze module, which also contains the Categorization, Confidence Interval, Distribution Adjustment and ABC Analysis plug-ins.
The correlation matrix is available if you have licensed the module 2analyze for SimAssist.
The Correlation Matrix plug-in has links to a total of four other plug-ins. First, there is a connection to the plug-in Database Definition, which acts as a data source and thus provides the data pool to be calculated for the analysis.
Via the SQL Expressions plug-in, the data pool can be specified individually via SQL queries. It is possible to export the diagram to a reporting document where it can be integrated into the project documentation, for example.
In addition, the diagram can be exported to a PowerPoint presentation using the PowerPoint plug-in.
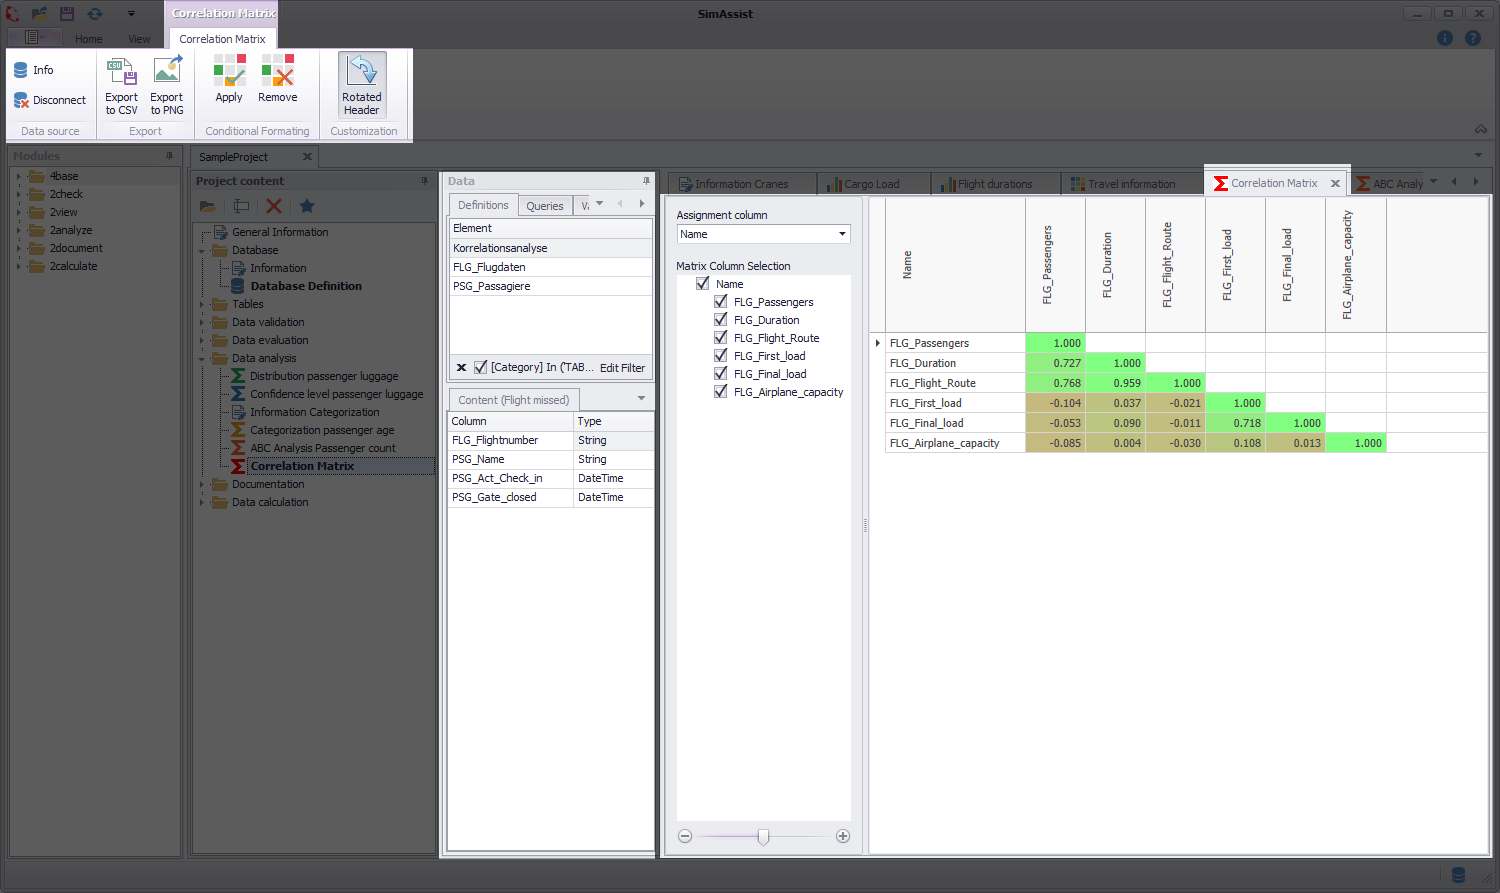
Figure 2 - Structure
The Correlation Matrix plug-in consists of three different sections. First, the plug-in menu can be seen at the upper edge, in which various settings can be made.
Below this, on the left, is the data area. Here, the data that is to serve as the basis for the calculation can be added to the plug-in. For more detailed information, please refer to the chapter Pivot Fields.
The largest part of the plug-in is the content area (plug-in window). Here the results of the calculation are displayed in graphical form.
In the Assignment column area, the column from the data source that is to be used for the display can be selected.
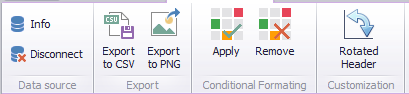
Figure 3 - Menu
In the following table, the individual buttons from the menu are explained:
Button |
Description |
|
Displays a dialog listing the currently connected data source, table and SQL query used.
|
|
Disconnects the current data source |
|
Opens a dialog where the export to a *.CSV file can be parameterized
|
|
Opens the Windows Explorer to save the current diagram as a *.PNG file |
|
Applies the conditional formatting parameterized in the options to the current diagram.
|
|
Removes the conditional formatting from the current diagram
|
|
Rotates the column heading by 90°, so that if there are several column headings, they are easier to read. , |
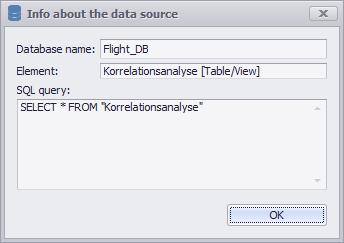
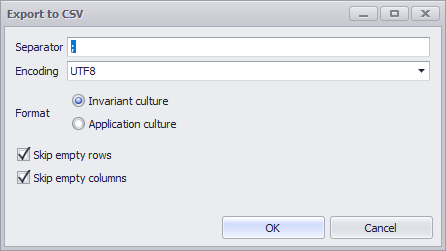
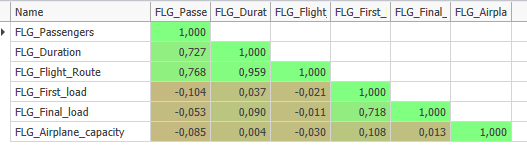
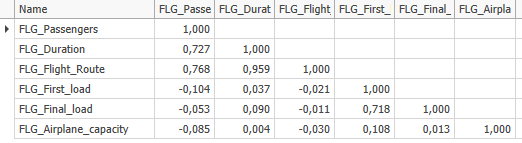
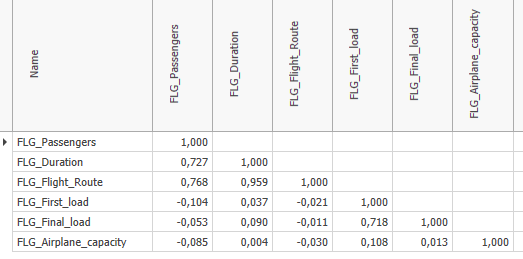
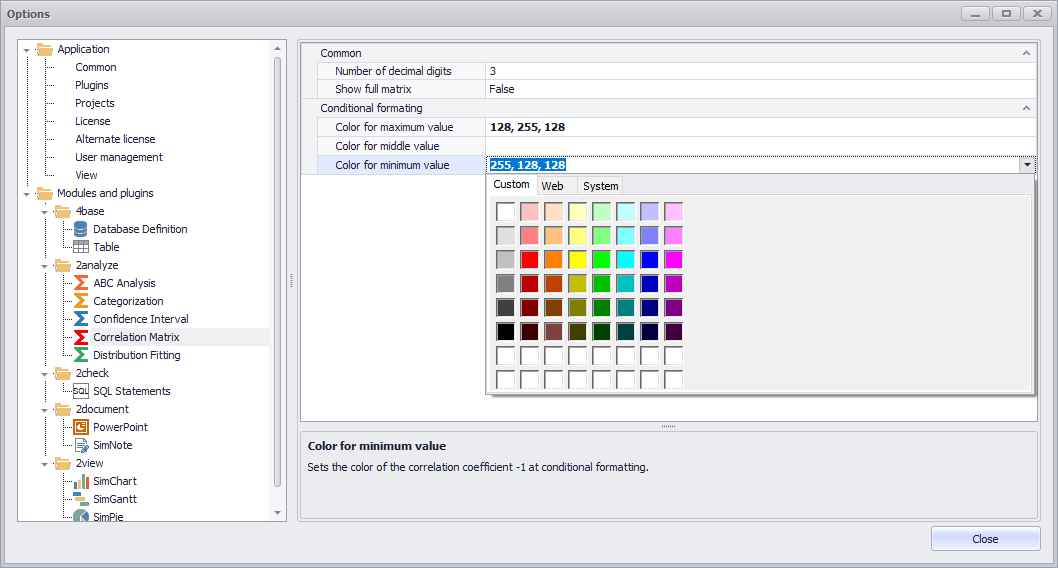
Figure 4 - Options
In the general SimAssist options (see Figure 4) some settings can be made for the plug-in. The following table gives an overview of the setting options:
Option |
Description |
||
General |
|||
Number of decimal digits |
The correlation coefficients are rounded to this number of decimal digits |
||
Show full matrix |
Display of the complete matrix (Figure 5 "false") or only one side of the diagonal (Figure 6 "true")
|
||
Conditional formatting |
|||
Color for maximum value |
Sets the color for the correlation coefficient 1, if conditional formatting is active. Colors can be specified by entering RBG color values, or selected using the drop down. |
||
Color for middle value |
Sets the color for the correlation coefficient 0, if conditional formatting is active. Colors can be specified by entering RBG color values, or selected from the drop down. |
||
Color for minimum value |
Sets the color for the correlation coefficient -1, if conditional formatting is active. Colors can be specified by entering RBG color values, or selected from the drop down. |
||
First, (suitably formatted) data must be added to the plug-in. Adding a data source to the plug-in works by Drag&Drop from the data area (see Figure 7).
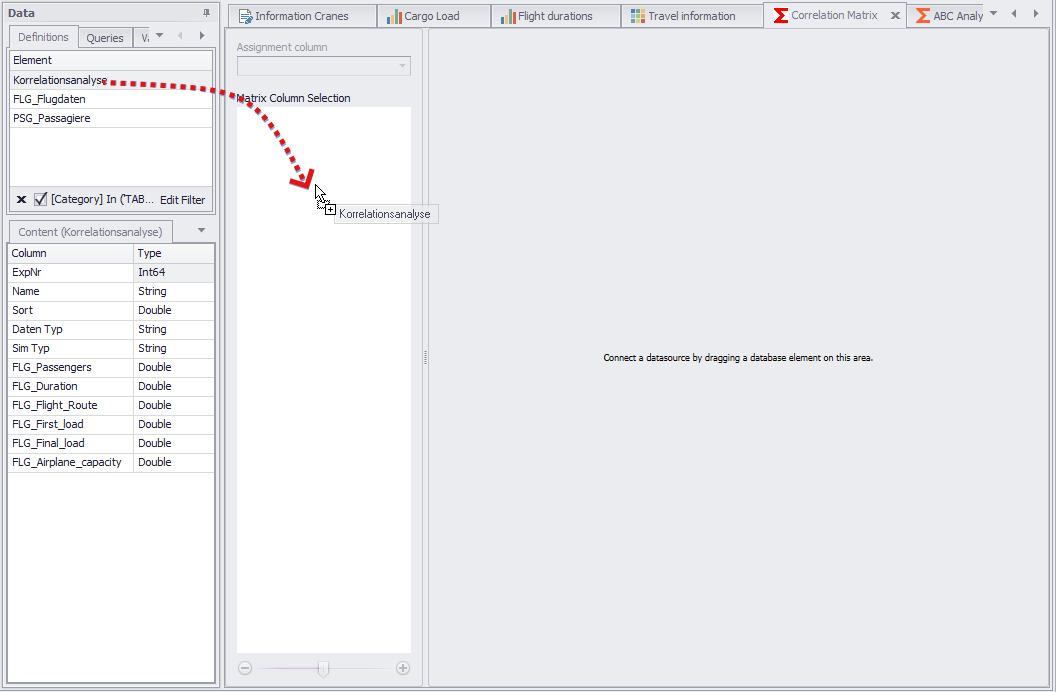
Figure 7 - Adding Data
3.2 Selection of Matrix Columns
After the data has been attached to the plug-in, the corresponding ones are available in the Assignment Column drop down (see Figure 8).
Using this drop down, the column in which the data of the correlation matrix is located must now be selected (in this example, the Name column)

Figure 8 - drop down Assignment Column
Now the correlation matrix can be built by setting check marks in the corresponding check boxes. Columns can be added to or removed from the matrix with a mouse click.
A click on the assignment column (here: Name) automatically selects all available columns.
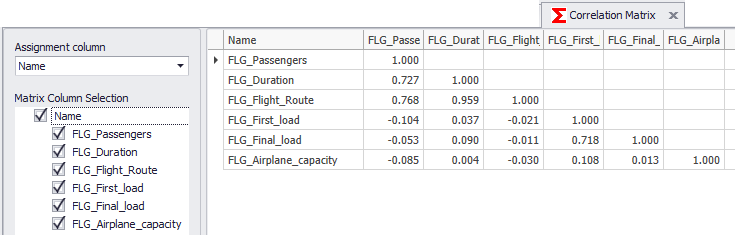
Figure 9 - Column Selection
The correlation matrix is used to get a first insight about simple relationships between parameters. The values in the cells indicate how the parameters relate to each other.
This means that with a value of "1", one value increases when the other increases. With a value of "-1" it behaves the other way round, here the value of one parameter decreases if the other increases, and vice versa.
In this example, the data from the FLG_Passengers and FLG_Flight_Route columns have a positive correlation:
That is, the longer the flight route (FLG_Flight_Route), the greater the number of passengers on that flight (see Figure 10).
Using the Apply button from the Conditional Formatting category in the menu, the correlation matrix can be highlighted in color. The respective colors can be defined in the options.
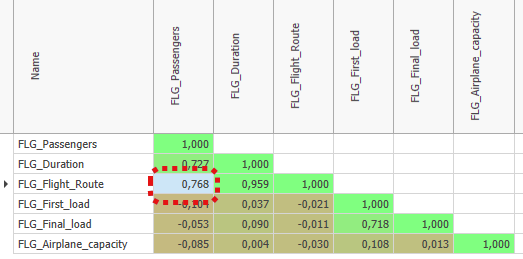
Figure 10 - Evaluation Correlation Matrix
Using these relationships, initial, simple conclusions about the system can be drawn from the correlation matrix. This makes it possible to validate logical system behavior, but also to discover unexpected things.
© SimPlan AG - Hanau District Court, Commercial Register (Part B) 6845 - info@simplan.de - www.simplan.de/en