Input data
The input data of the scatterplot analysis consist of an X- and a Y-coordinate, of which the relation to each other is to be examined.
For this, manipulated variables as well as result variables can be used. As further input value a class is needed. This can be a categorical value or the cluster assignment of the clustering.
Figure 1 shows an example of the input field.
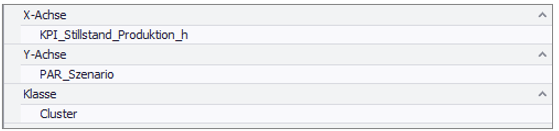
Figure 1 - Example Input Scatterplot Analysis
Interpretation example
Scatterplot analysis can be used to quickly get an impression about influences of manipulated variables in the context of cluster assignments or other categorical factors on different KIPs (e.g. scenarios).
In the following example, the influence of production volume filtered by cluster assignment on production downtime is shown.
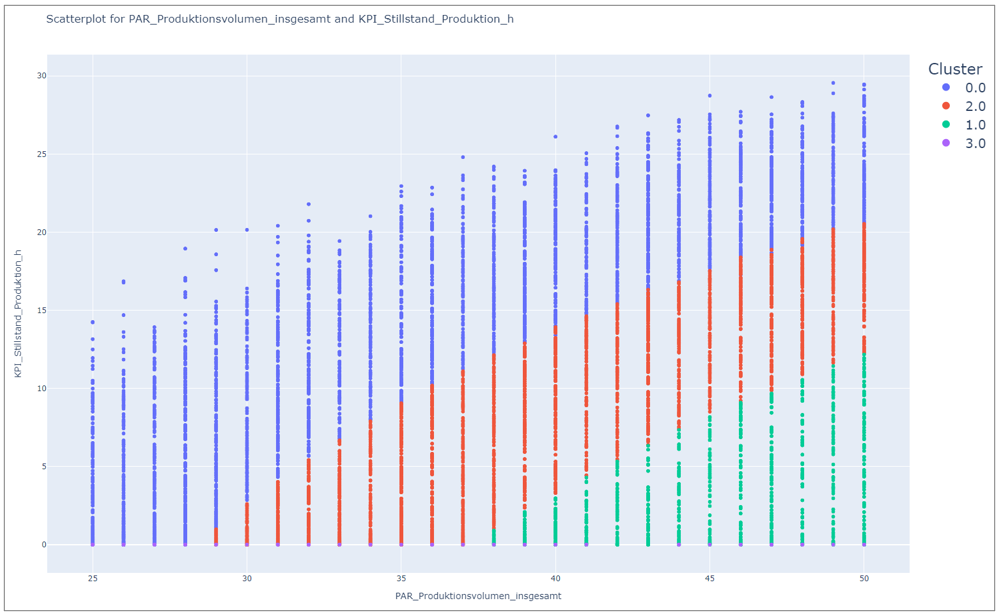
Figure 2 - Scatterplot analysis
Through Figure 2, it is clear that Cluster 0 has the worst performance in the banned reference, and Clusters 1 and 3 have the best, as low downtime is achieved despite high production volume.
However, it is noticeable that cluster 3 is probably assigned only a small number of experiments, since only a few points whose downtime is 0 can be seen at the bottom.
The oblique course of the dividing lines suggests a multidimensional relationship - at least one other factor also has an influence on the cluster assignment.
Consequently, further analyses using multidimensional methods should be carried out in this context. E.g. radar plots, parallel plots or classification trees.
© SimPlan AG - Hanau District Court, Commercial Register (Part B) 6845 - info@simplan.de - www.simplan.de/en