This section shows a short, example use case for the plug-in and its functions.
Tasks in this use case:
3. Create and apply distribution
5. Calculate and evaluate results
After SimAssist has been started and a new project including the plug-in SimProject has been created, the first step is to import a project plan.
To do this, click the Import button in the plug-in menu (see Figure 1). Then the Windows Explorer opens to select the desired project plan.
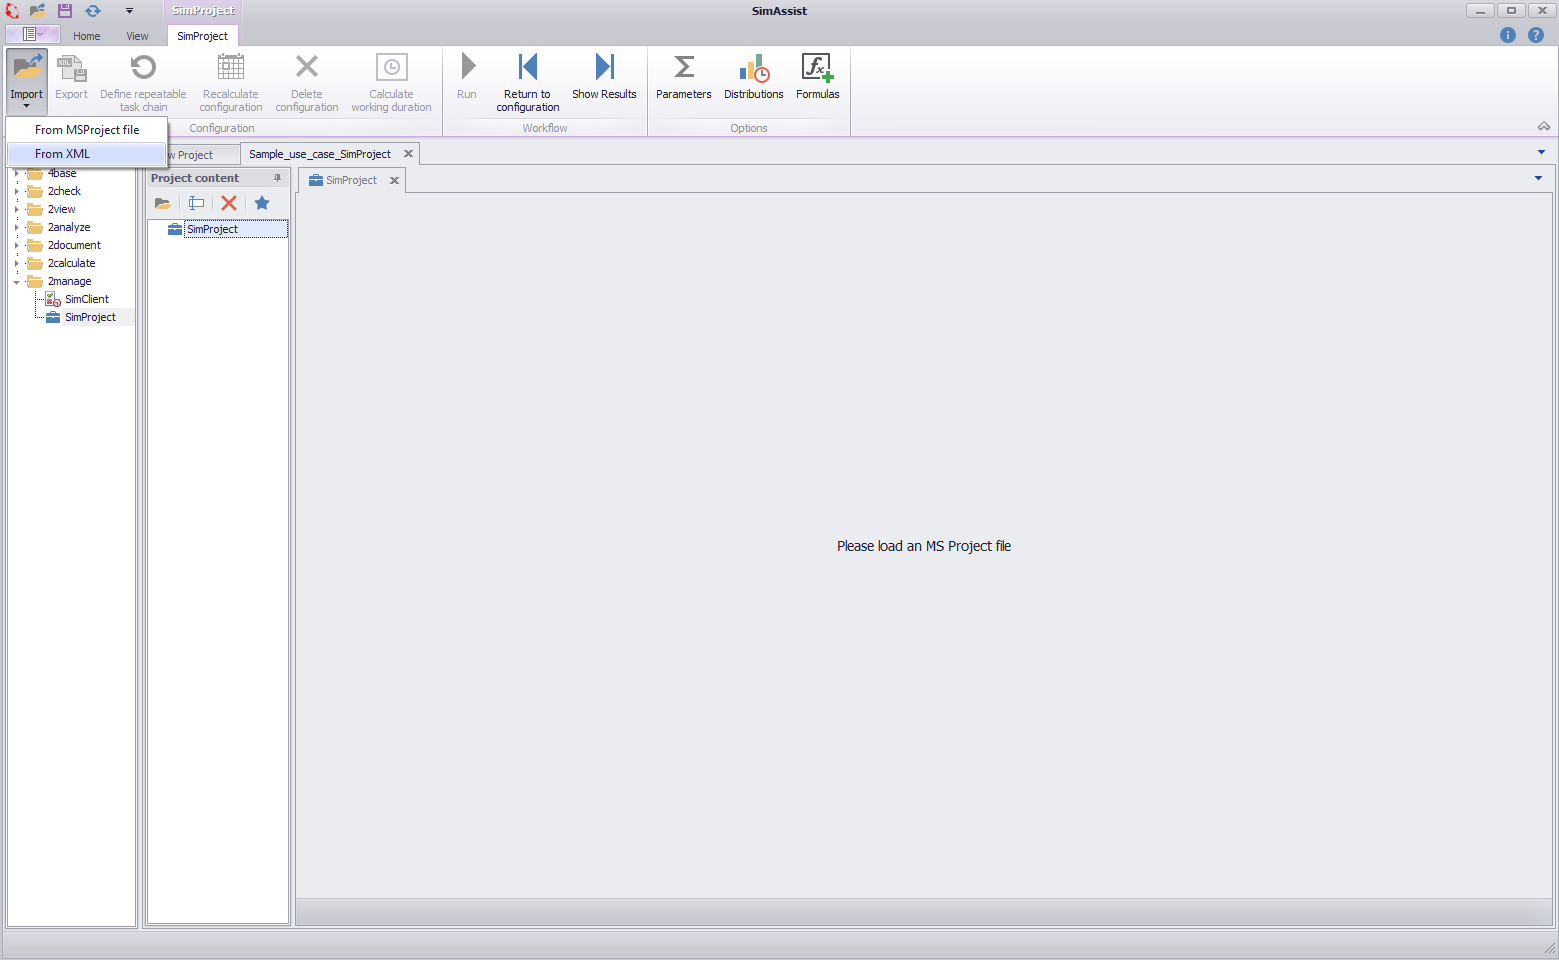
Figure 1 - Import project plan
After successfully importing a project plan, it will be displayed in the plug-in.
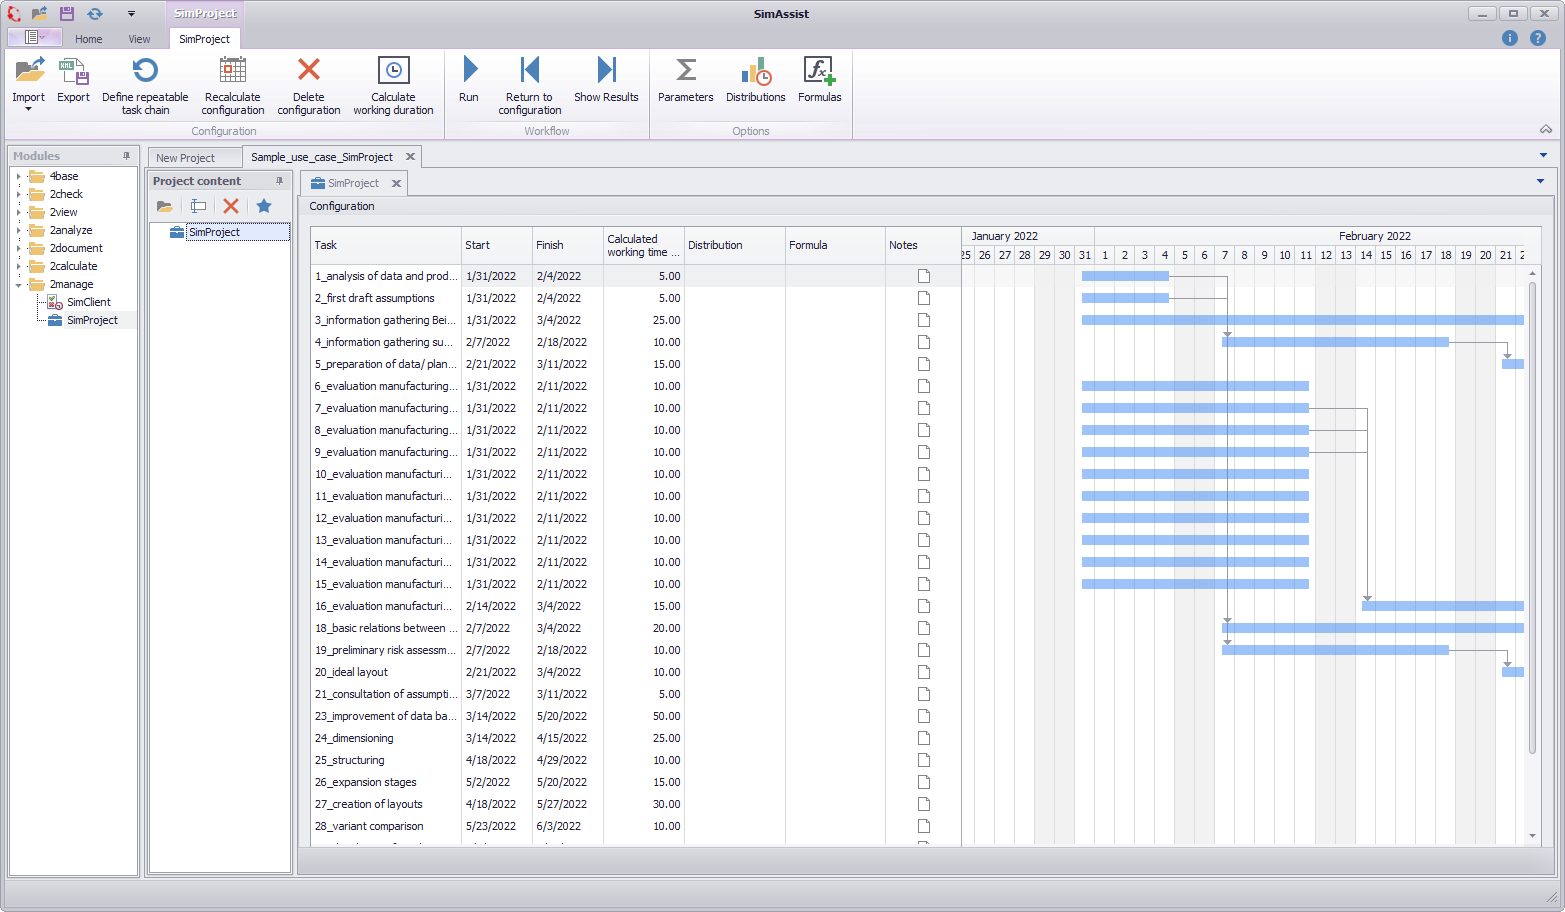
Figure 2 - Project Plan Imported
After the project plan has been read in, it can be saved as an XML file using the Export button.
In doing so, all tasks of the project plan are created and saved as XML tags.
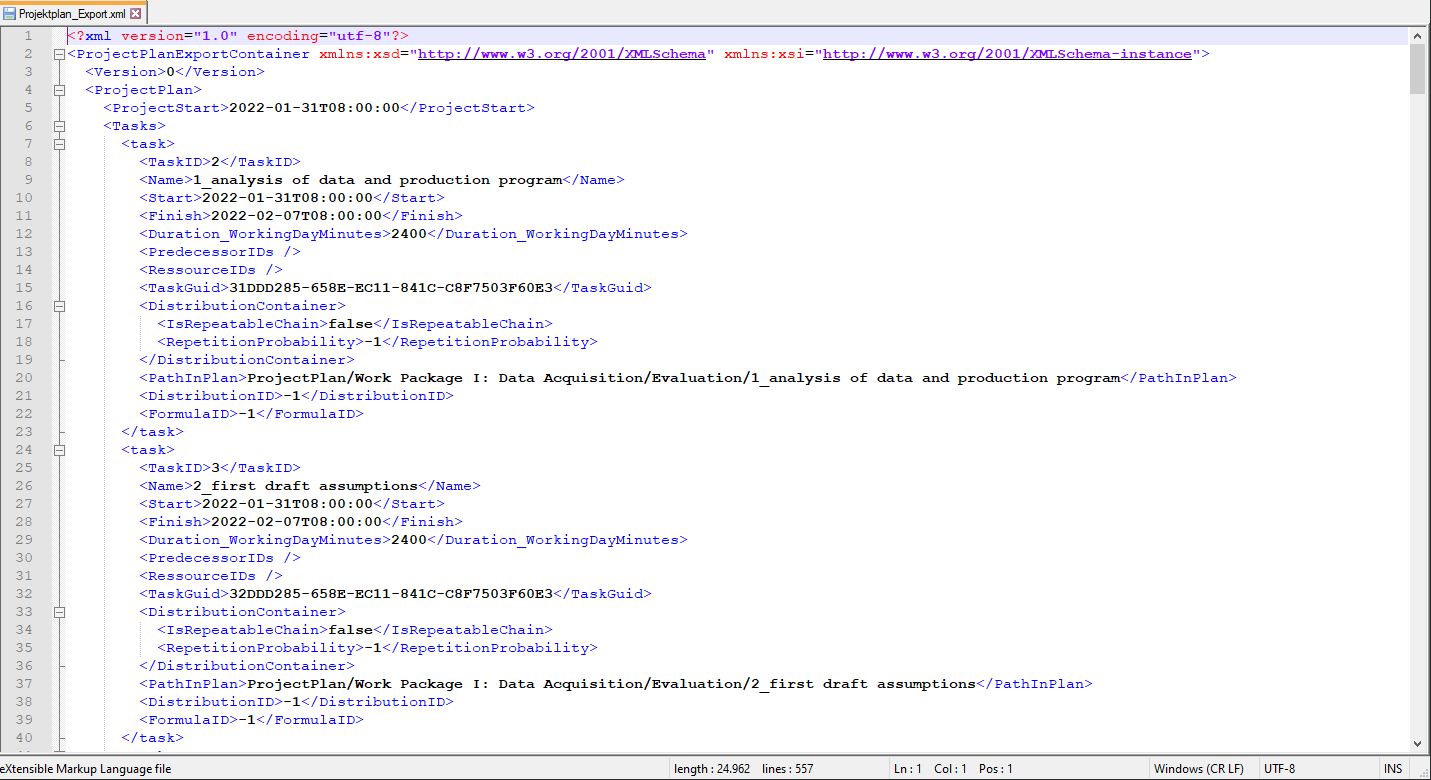
Figure 3 - Project plan as XML
3. Create and apply distribution
With the help of the button Distributions in the menu of the plug-in, different distributions can be created via the distribution editor and assigned to one or more tasks in the project plan.
To do this, a new distribution must first be created in the distribution editor via the New button.
Then the distribution can be selected via the drop down Type of distribution - in this example the equal distribution.
This distribution describes the stochastic variation of the net working time of the respective task during the simulation.
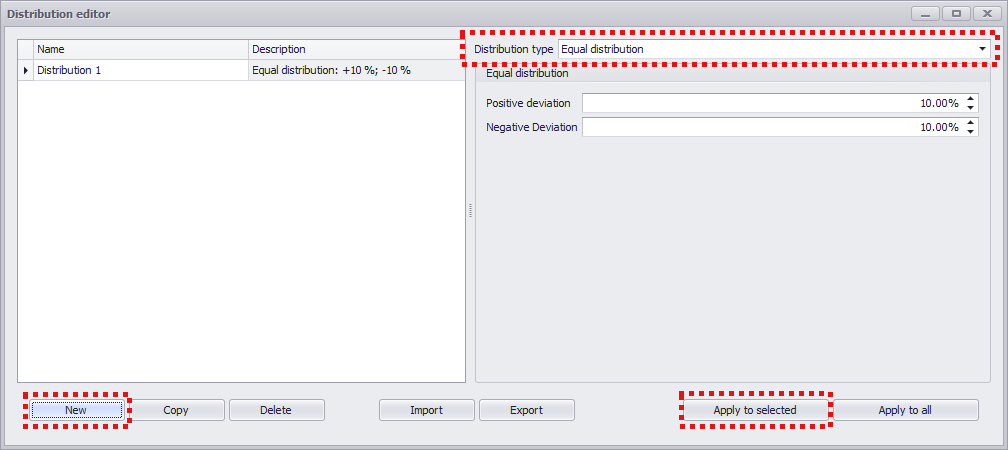
Figure 4 - Select Distribution
Assignment to one or more tasks is done using the Apply to selected or Apply to all buttons.
In this example, the created Distribution 1 is applied to the task 20_ideal_layout from the loaded project plan.
After selecting the corresponding item in the project plan view, the distribution can be applied using the Apply to selection button.
Alternatively, after the distribution has been created via the editor, it can also be selected via the drop down in the corresponding row in the Distributions column.
In this case, the distribution will not be applied until the simulation is performed, which is described in step 5.

Figure 5 - Distribution applied
Formulas are used to define the project duration with a certain uncertainty of exceeding and falling below. In this example a formula is created and additionally a variable is used for one parameter of the formula.
To do this, a new variable must first be created using the Variables plug-in from the SimAssist 2check module.
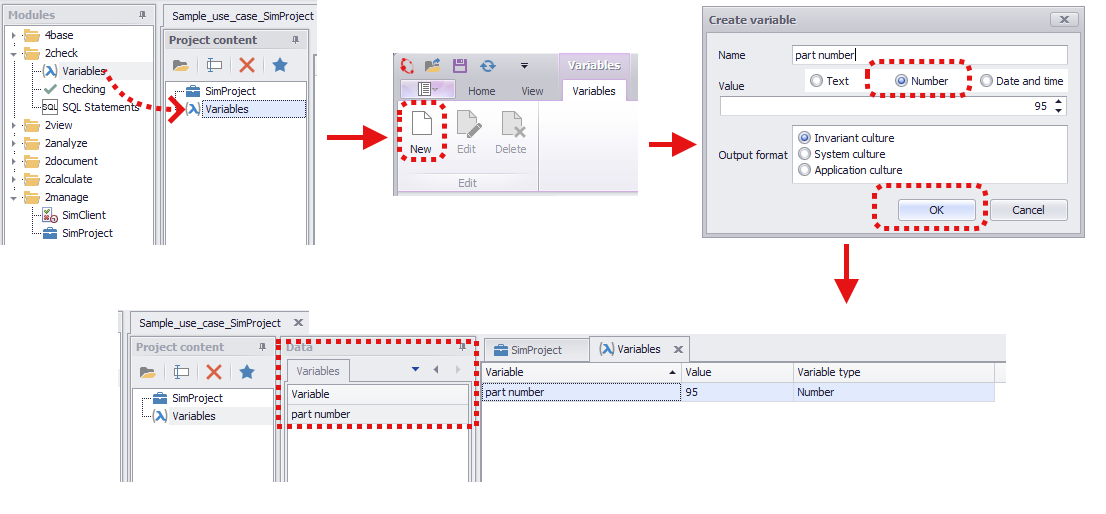
Figure 6 - Creating a Variable
Then a new formula is created via the formula editor, in this example a discrete formula.
This formula is now used to calculate the working time (in this example the working days) of the task to which the formula is assigned in the project overview.
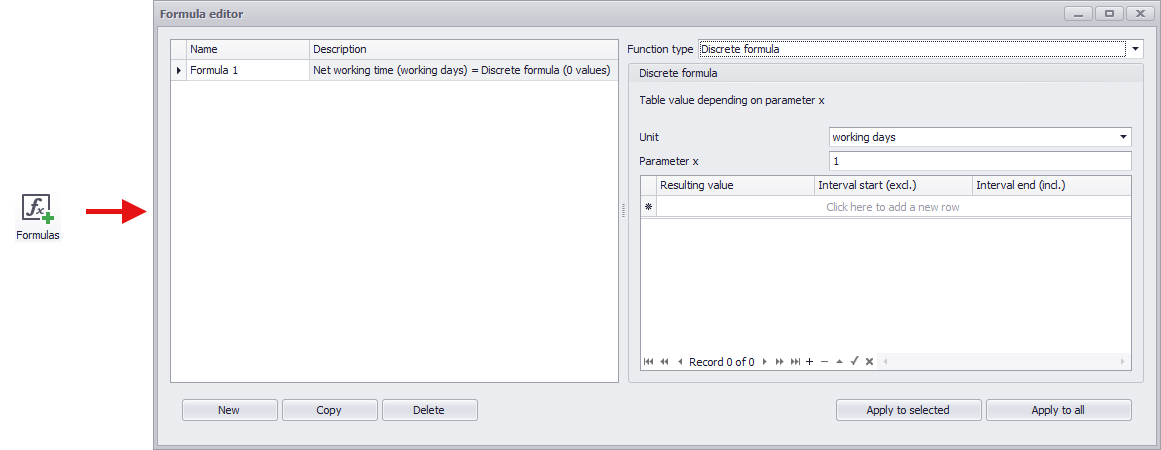
Figure 7 - Creating a Discrete Formula
For the discrete formula, the following values are now entered into the table:
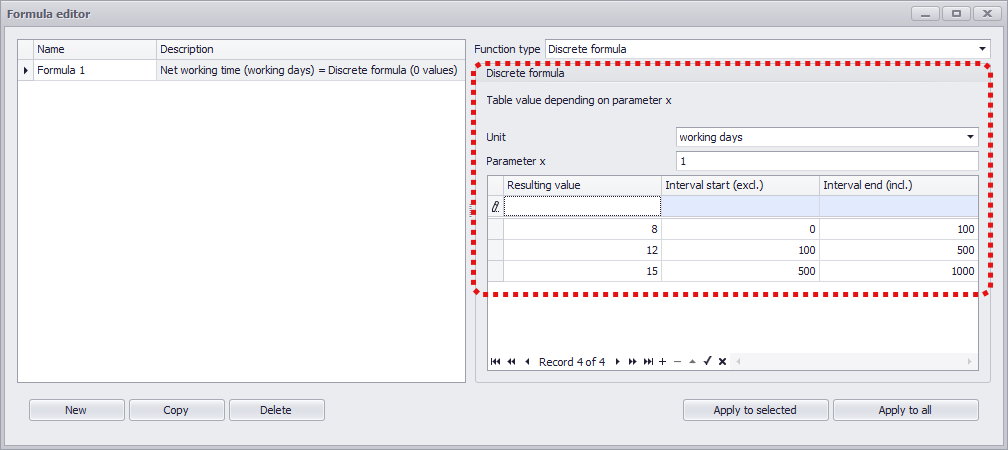
Figure 8 - Entering Values for Formula
Now the variable created before is used as Parameter x:
There are two possibilities for the assignment:
•Drag&Drop the variable from the data area in the Variables tab directly onto the input field (see Illustration 9).
•Enter the name of the variable via text input into the text field
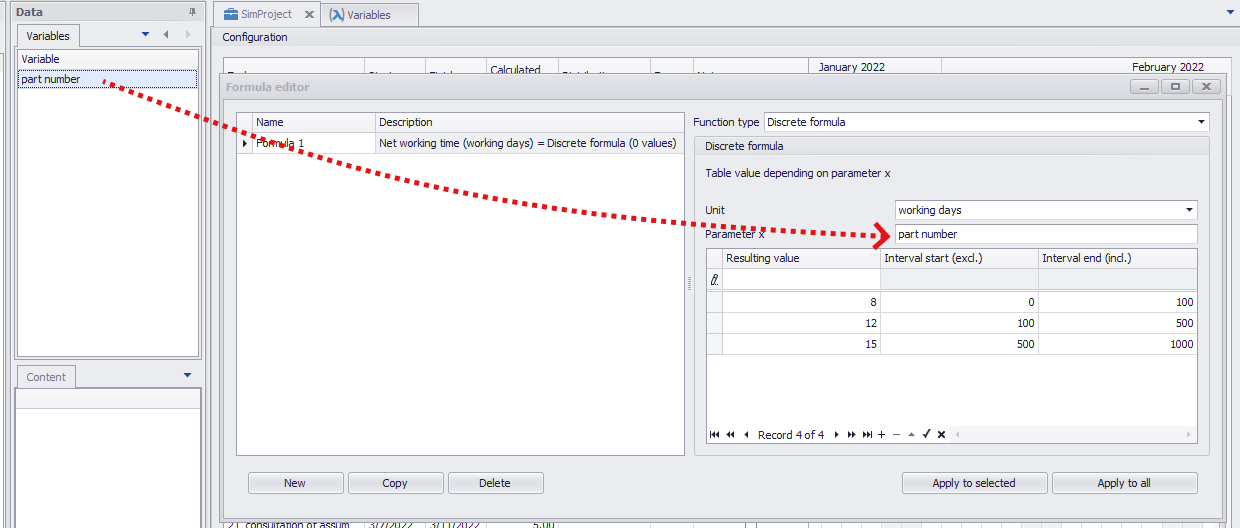
Figure 9 - Use Variable
Now the formula is ready and can be applied to one or more tasks in the project plan.
The working time of the respective task is thus directly dependent on the value of the created variable.
For example, if the value of the variable is 95, as shown in Figure 6, this results in a working time of 8 working days (value 95 is in the interval 0-100; see Figure 9).
In this example, the formula just created is assigned to the task 7_evaluation manufacturing process stacking.
Assigning can be done again either by clicking the Apply to selection button if the task has been selected before, or by using the drop-down list of the respective task if the formula has already been created.
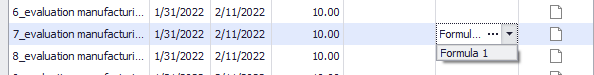
Figure 10 - Formula Applied
To see the effect of the formula directly in the configuration view, the Calculate Work Duration button can be used.
The formula will then be applied and the newly calculated working time will be displayed in the Calculated Working Time(Unit) column.

Figure 11 - Apply Formula
5. Calculate and evaluate results
Before the simulation of the project plan is started next, additional parameters for the simulation can be set using the parameter editor.
In this example, the simulation count after optimization is set to 300 and the number of optimized candidates is increased to 4 (see Figure 12).
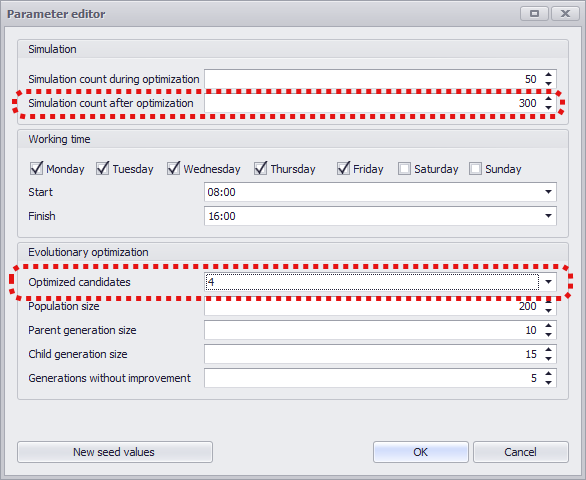
Figure 12 - Parameter Editor
Subsequently, the simulation is started via the Run button. After a successful calculation, the program automatically switches to the results view.
Here, the results of the simulation with the set parameters are displayed in tabular form in the upper area and graphically in the lower area.
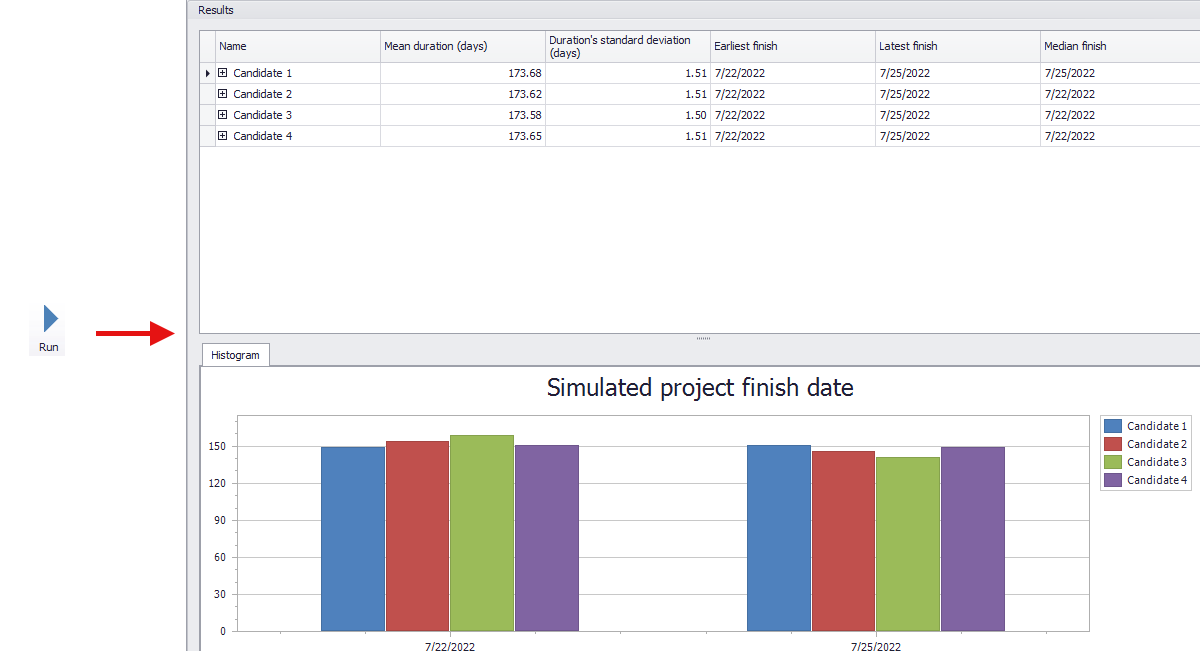
Figure 13 - Results View
The results can now be viewed for each individual candidate. In the Task Statistics tab, the results of the simulation(s) are listed in summary for all tasks.
Using a distribution for the point 20_ideal_layout results in a standard deviation for this point in the results (see highlighted element in Figure 14).
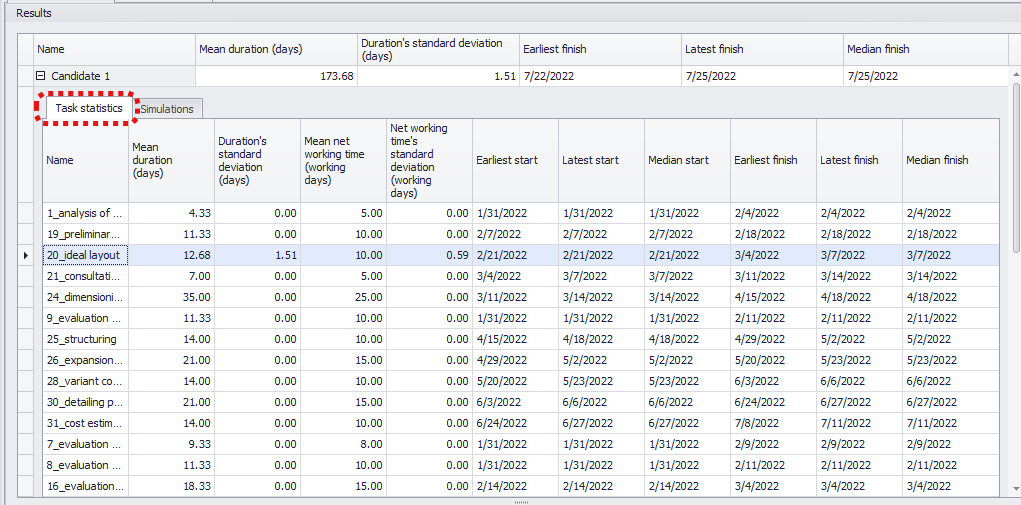
Figure 14 - Results Candidate 1
The Simulations tab lists all simulations performed (300 in this example, as defined in the Parameter Editor).

Figure 15 - Simulations Tab
This list can also be expanded again and details can be viewed. Alternatively, a double-click on a simulation run can open a new window showing the results in detail.
Any number of windows can be opened to make direct comparison easier (see Figure 16), and the desired simulation run can be set again in each window.
In this example, the details of the first, the 50th and the 150th run are considered.
Here we can see that the working time for the item 20_ideal_layout increases, and at the 150th run it even causes the end of the operation to be postponed to another day.
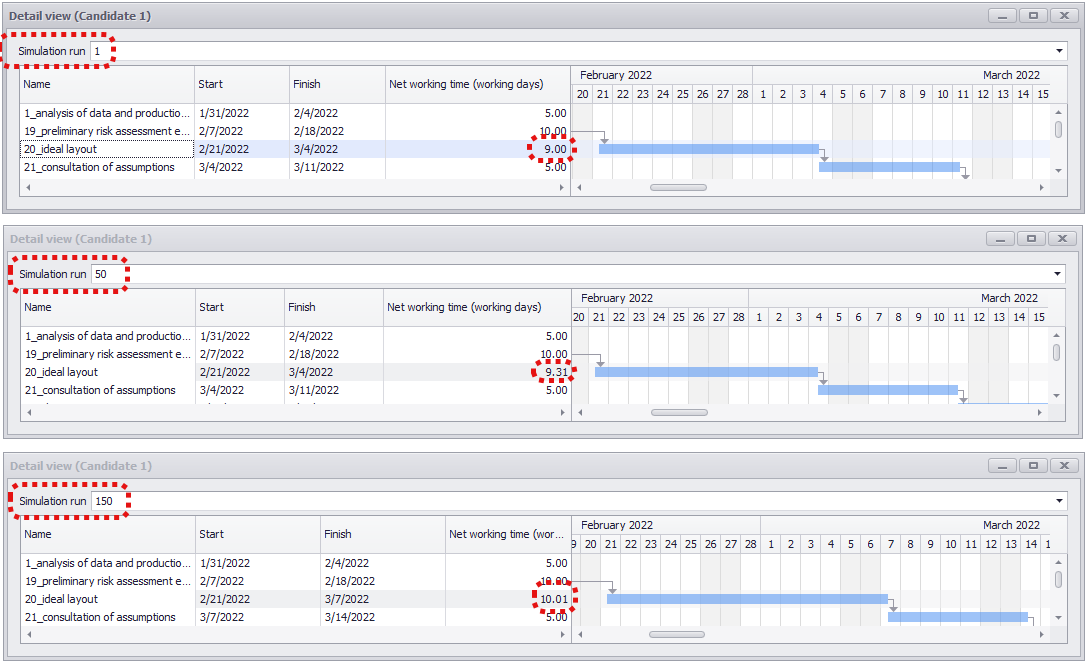
Figure 16 - Simulation Details Arranged One Below the Other as a New Window
The last step is to export the results of the simulation. For this purpose, the SimAssist plug-in PowerPoint from the 2document module is used.
Then the desired instance of the SimProject plug-in is added as source to the PowerPoint plug-in and the Export to PowerPoint button is used to start the export.
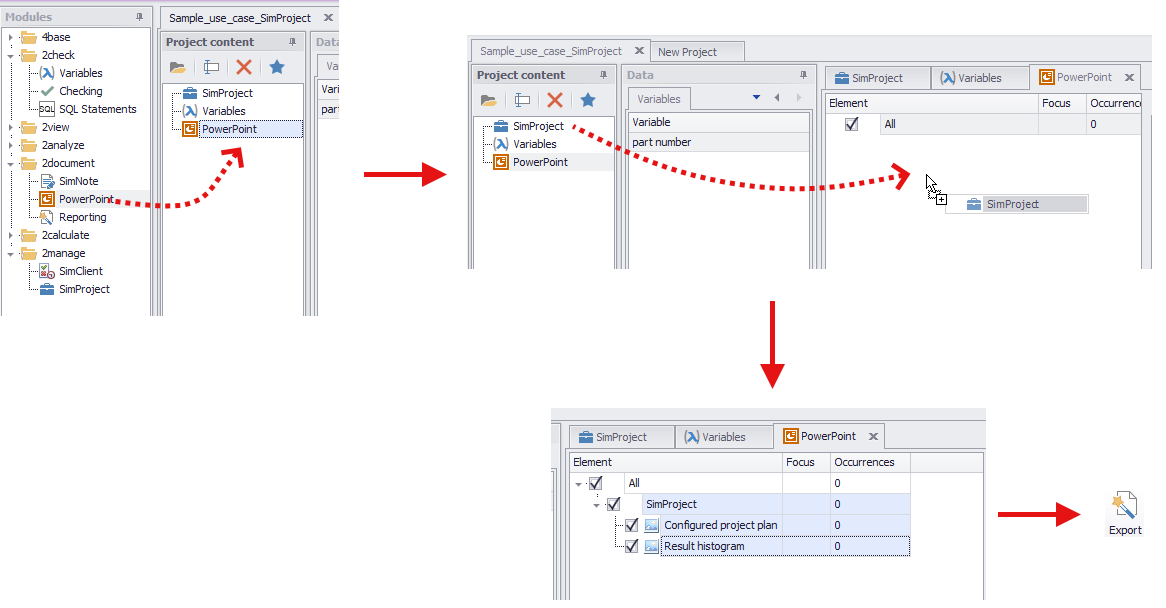
Figure 17 - Export to PowerPoint
After successful export, the PowerPoint presentation is opened automatically - it contains both the configured project plan and the result histogram.

Figure 18 - Export Result
To export the tabular statistics from the upper area, the following steps are necessary:
1.Select a desired area, either with the mouse or by using the key combination (SHIFT + arrow keys) (optionally select all (CTRL + A)).
2.CTRL + C to copy the data of the area
3.Paste the data into Excel, for example, using the key combination CTRL + V
|
Information When exporting data, the following principle applies: "What you see is what you get" - this means that exactly those data sets are copied which the user has displayed. |
© SimPlan AG - Hanau District Court, Commercial Register (Part B) 6845 - info@simplan.de - www.simplan.de/en