This section explains the result view of the plug-in.
As soon as all desired settings, parameters and forms have been set, the calculation can be started by clicking on the Run button
While the calculation is running, this is visualized in the status bar: ![]()
The red X button ![]() can be used to cancel the running calculation.
can be used to cancel the running calculation.
After the calculation is finished, the program automatically switches to the result view (see Figure 1).
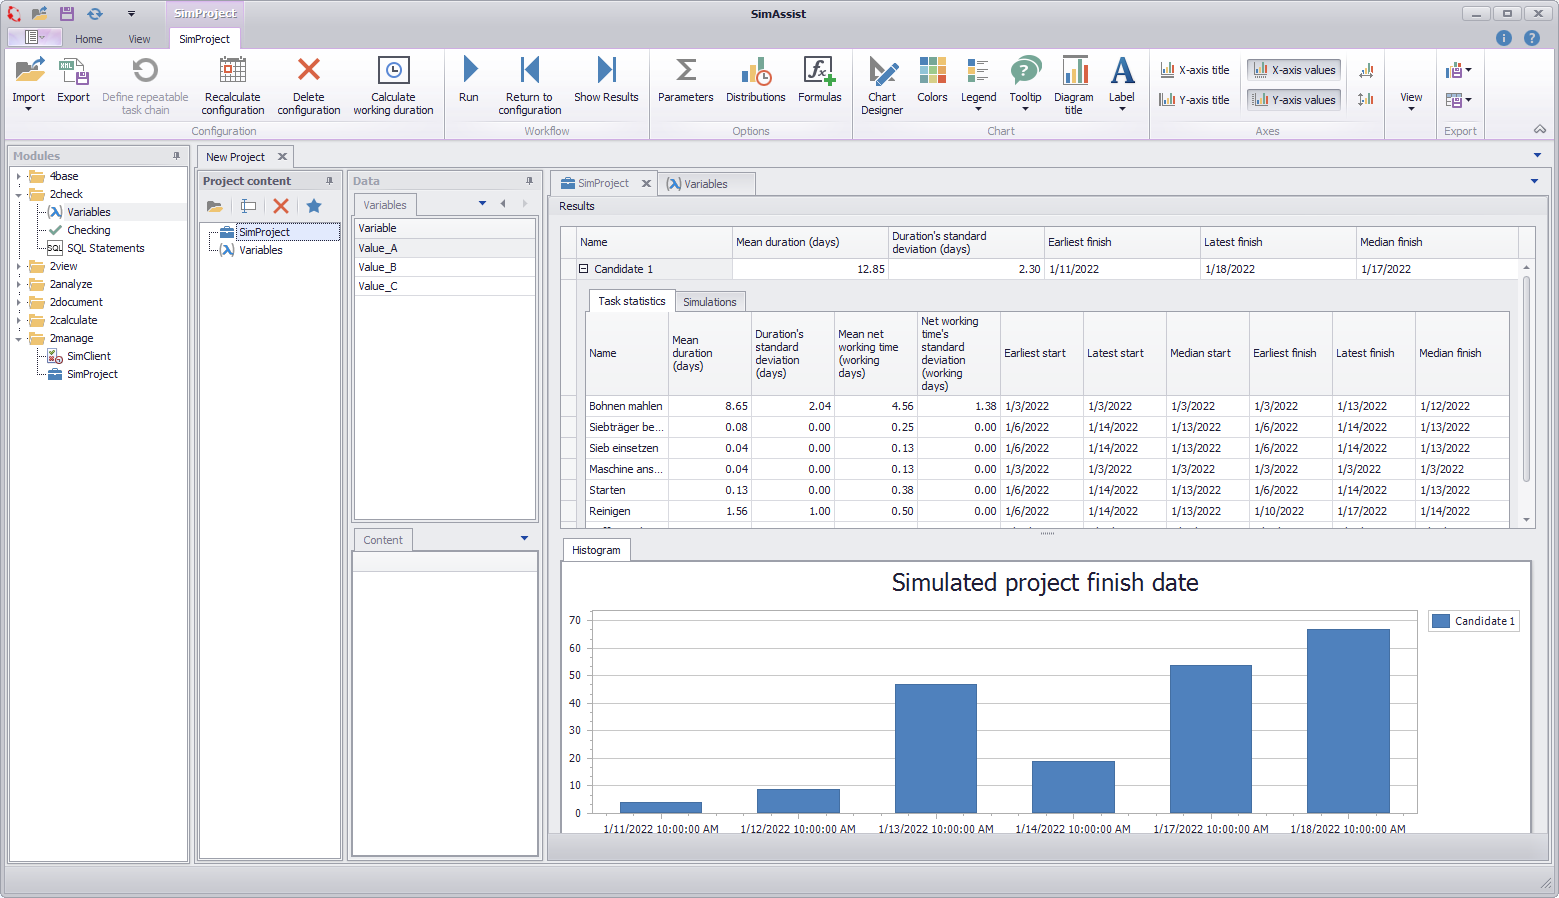
Figure 1 - Results View
The result view is divided into two main areas:
In the upper area the results are displayed as statistics (divided into task statistics and simulations), in the lower area the simulated project end is displayed as a histogram.
|
Information If the configuration is changed and a result already exists, the following note is displayed in the status bar (bottom left): |
The Optimized candidates option in the parameter editor can be used to specify how many candidates are to be calculated.
Depending on the selected number, the corresponding candidates are displayed in the task statistics. These can be shown or hidden using the + icon.
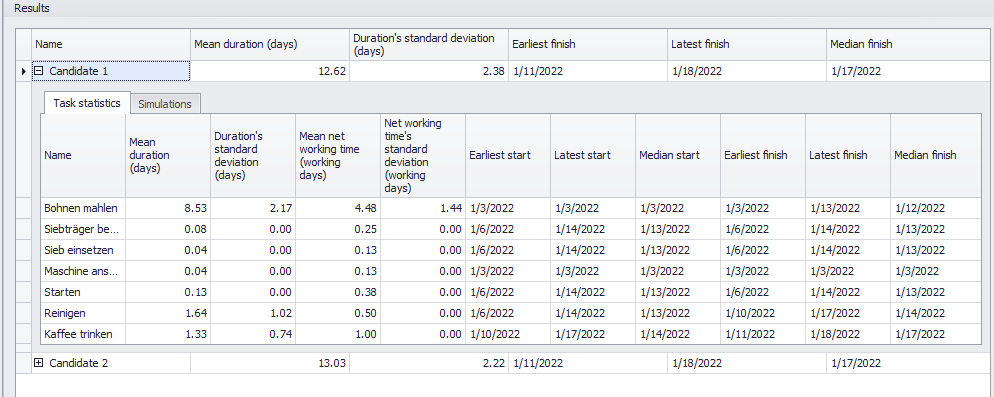
Figure 2 - Optimized Candidates
This tab lists the statistics for the tasks present in the project plan. The following statistics are calculated and displayed:
•Name
•Mean duration of the task in days
•Standard deviation of the duration in days
•Mean net working time in days
•Standard deviation of net working time in days
•Earliest start
•Latest start
•Median of start
•Earliest finish
•Latest finish
•Median finish
In this tab, the calculated simulations are listed for each calculated candidate. These can also be shown and hidden using the + icon.
For each simulation the following statistics are calculated and displayed:
•ID
•Start (date)
•End (date)
•Project duration in days (including vacations and weekends)
The number can be defined again via the parameter editor using the option Simulation runs after optimization.

Figure 3 - Simulations collapsed

Figure 4 - Simulations Expanded
For a better overview in the view shown in Figure 4, a detailed view can be called up by double-clicking (or using the context menu) on an entry.
This process can be repeated as often as required, allowing multiple simulation details to be opened side by side for comparison.
Optionally, the desired run can also be selected via the Simulation Run drop down.
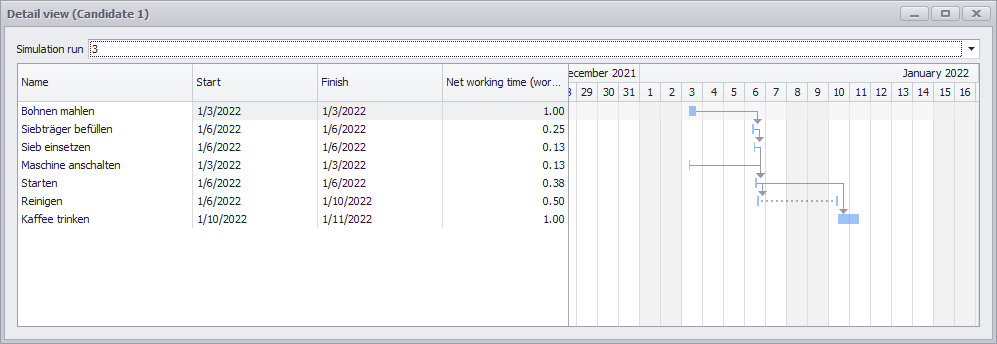
Figure 5 - Detail View
Histogram of the simulated project finish date
In this section, the simulated project end is displayed as a histogram. The respective date is displayed on the X-axis and the number of simulations on the Y-axis.

Figure 6 - Histogram of the simulated project finish date
The view is displayed grouped. This grouping can be set by clicking the Orientation button in the menu and then displaying the pivot table.
The automatic grouping (recognizable by the square brackets [ ] ) can be changed or deactivated via the context menu entry Grouping.
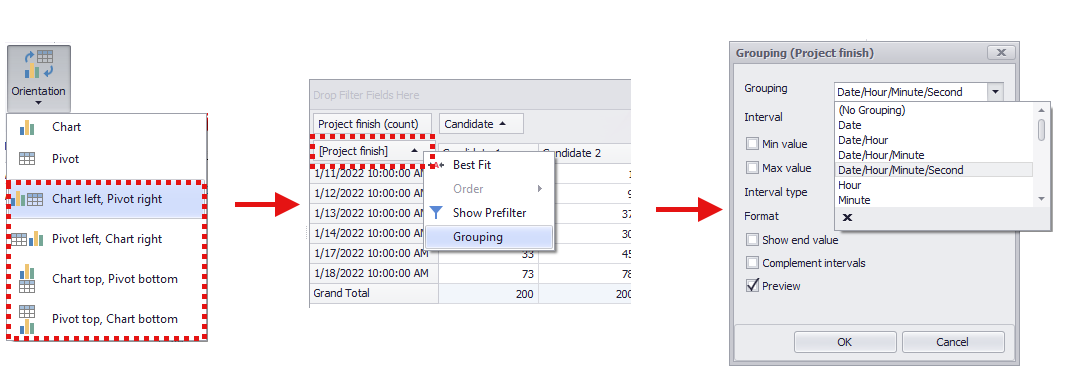
Figure 7 - Edit Grouping
© SimPlan AG - Hanau District Court, Commercial Register (Part B) 6845 - info@simplan.de - www.simplan.de/en