The following comprises instructions for the Reporting plug-in.
Contents
1. Introduction to the plug-in
1.3 Position in the Overall Software Package
3.3 How to Subsequently Refresh Content
1. Introduction to the plug-in
The Reporting plug-in has been designed to offer you a high-performant tool in SimAssist to help you create your project documentation easily and efficiently.
Reporting offers a great way not only to produce quick notes but also detailed project documentation directly in SimAssist.
A user interface familiar from Microsoft Office products, guaranteeing rapid access to the editing tools required, is available for this purpose, whereby the following features are of particular interest:
•Import of visualizations previously copied to the clipboard from other plug-ins
•Export of entire documentation/note in full
•Range of tools especially tailored to documentation requirements in the simulation sector
1.3 Position in the Overall Software Package
The Reporting plug-in is part of the 2document module, which also contains the SimNote, PowerPoint and Excel plug-ins. Reporting is available when you license the 2document module for SimAssist.
The Reporting plug-in is linked to all plug-ins with visualizations that can be copied to the clipboard and then added to a Reporting document.
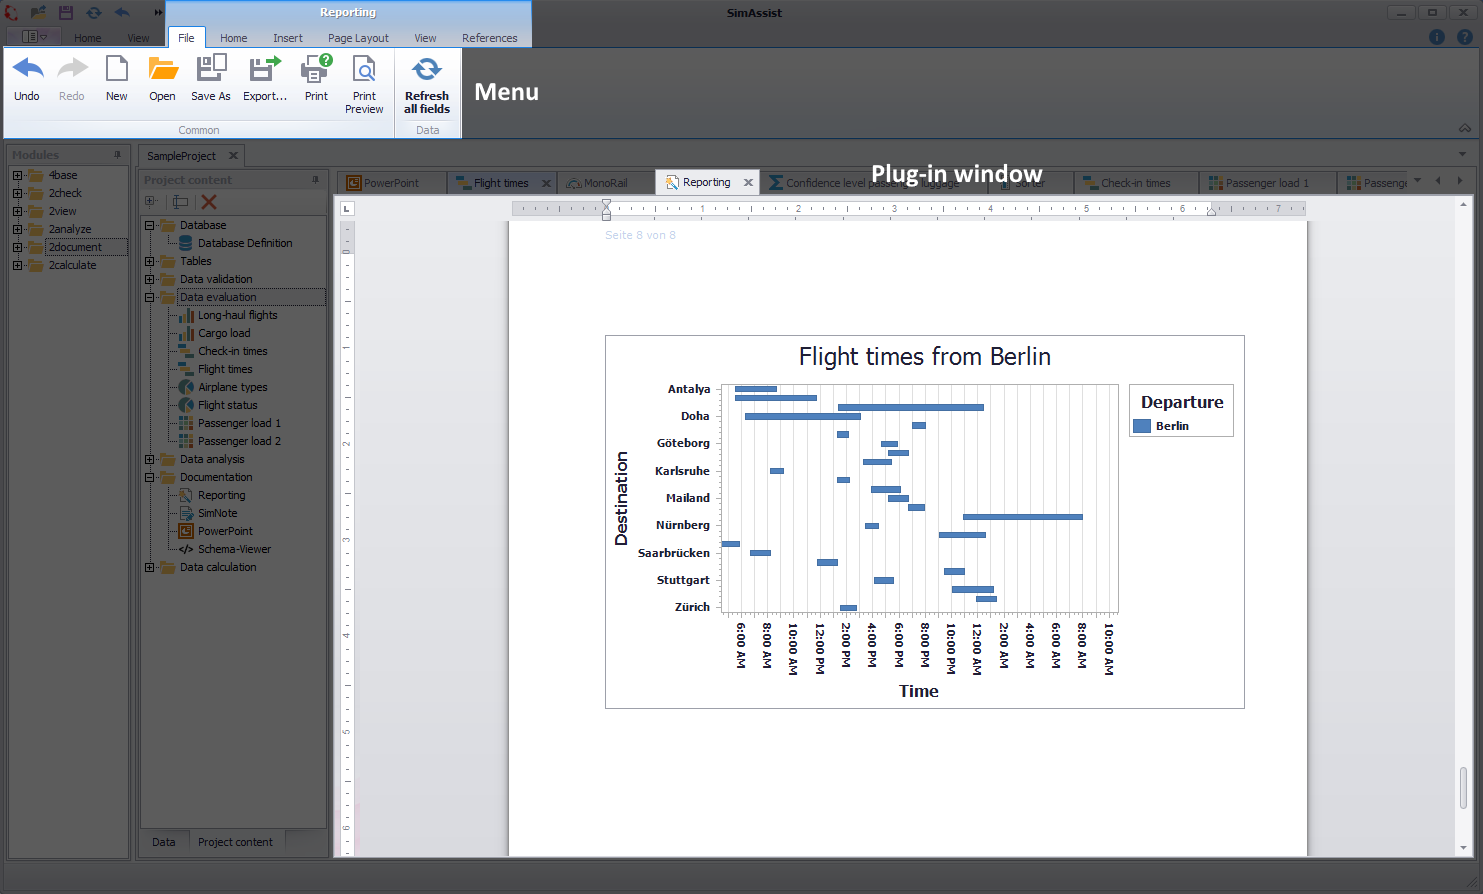
Figure 1 - Layout of the Reporting plug-in
The Reporting plug-in is divided into two areas, with the menu displayed at the top and the document displayed at the bottom.
The Reporting plug-in menu is also divided into two areas (see Figure 2). At the top is the tab bar, which provides access to the various tool categories.
Below this is the tool area, which contains the individual tools that you can choose here to edit the document.
In addition, a quick access toolbar is also available right at the top, via which you can also access all the key functions at all times.
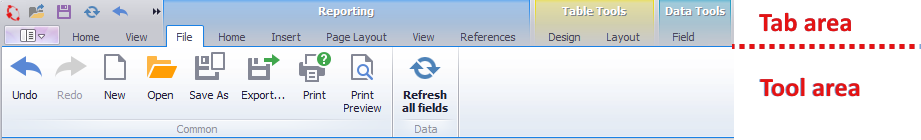
Figure 2 - Reporting plug-in menu
The individual tabs are briefly presented below, along with an explanation of their functions:
Reporting - File
The File tab contains the administration functions for the Reporting document. Here, you can create, save, export and also print new documents.
Just like in most Microsoft Office products, a classical undo/redo function is also provided here, to undo and redo editing steps. You can choose Refresh All Fields to refresh all editing areas with just one click.

Figure 3 - File tab
Reporting - Home
On the Home tab, you can edit your document and create content. The appearance and use of this tab is based on the generally valid standards for Microsoft Office products.
The tab offers all relevant functions. You can, for example, specify the font size and type, choose the text color and background and configure the display type, such as justified.
You can also choose Styles to access predefined font designs, for headers, for example.
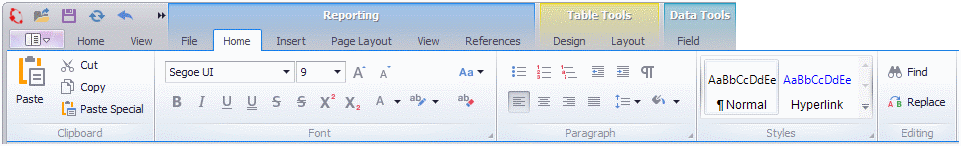
Figure 4 - Home tab
Reporting - Insert
The Insert tab provides functions you can use to add special elements to your document, which are in particular useful for the project documentation of simulation processes.
For example, you can insert tables, barcodes, check boxes and, of course, charts. You can also insert bookmarks, hyperlinks and special symbols.
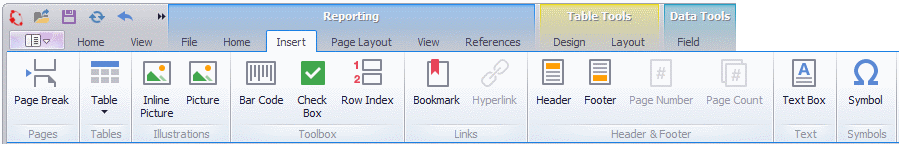
Figure 5 - Insert tab
Reporting - Page Layout
On the Page Layout tab, you can edit the layout of your document. You can specify the page margins and orientation, define the size and color of the page and manage line breaks and line numbers.
You can also organize your text into columns.
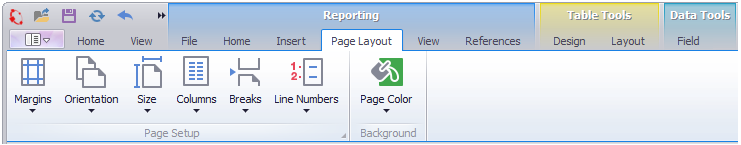
Figure 6 - Page Layout tab
Reporting - View
The View tab contains all the functions required for managing your document view.
For example, you can switch between the various document views (Simple View, Draft View, Print Layout), zoom in and out of the document and define the ruler display.
You can also manage the display of insertable fields on this tab. For example, you can enable/disable the field codes and field results here.
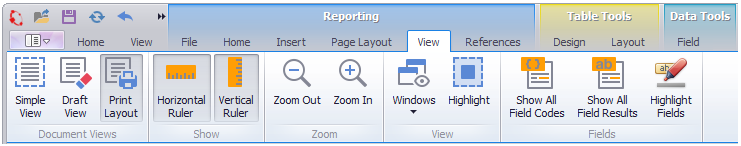
Figure 7 - View tab
Reporting - References
On the References tab, you can insert in the document references to elements.
For example, you can create a table of contents for tables, update the relevant tables of contents and add the paragraph currently selected to the table of contents.
You can, of course, also insert in the document headings for figures, tables and descriptions and update the table currently selected.

Figure 8 - References tab
As soon as you mark a previously inserted table, an additional chapter Table Tools with two new tabs (Design and Layout) appears in the menu.
Table Tools - Design
In the Design tab, the design of the selected table can be adjusted, as well as various templates for the design of the table can be applied.
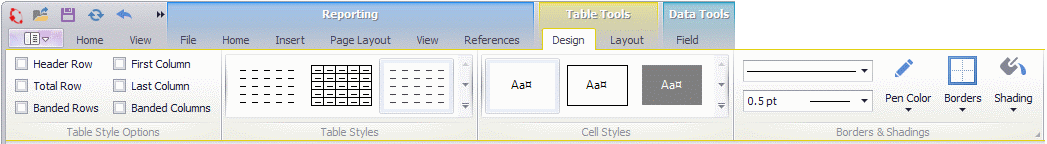
Figure 9 - Design tab
Table Tools - Layout
In the Layout tab, the layout of the selected table can be formatted and customized.
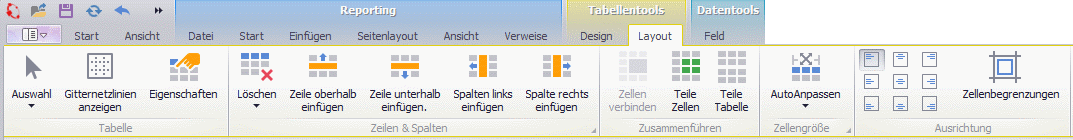
Figure 10 - Layout tab
Data Tools - Field
When you select a previously inserted field, an additional Field tab appears in the menu.
Depending on the type of field selected, various options are available here, which you can use to adapt the field to your specific requirements.
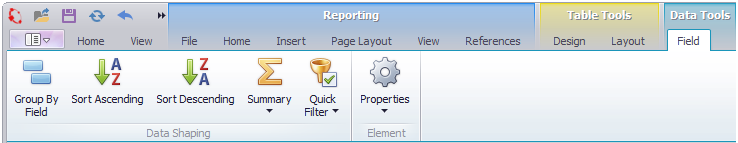
Figure 11 - Field tab
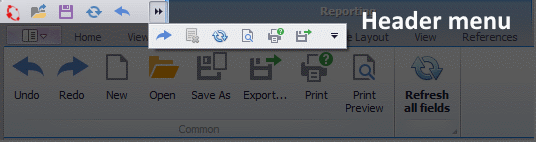
Figure 12 - Header Menu
The header menu provides you with quick access to administrative tasks such as undo/redo, refresh and print.
Button |
Description |
|
Undoes the last task performed. |
|
Redoes the last task undone. |
|
Deletes the selected field from the document. |
|
Refreshes all fields in the document. |
|
Calls the print preview and allows you to change the print settings. |
|
Calls the dialog box for printing the document. |
|
Enables you to export the document (performs the same task as the Export function in the plug-in menu). |
You can use the arrow icons in the header menu to configure which interaction elements you want to display in the header menu.
When you choose the arrow icon, a drop down menu appears in which you can click the desired functions to enable and disable them:
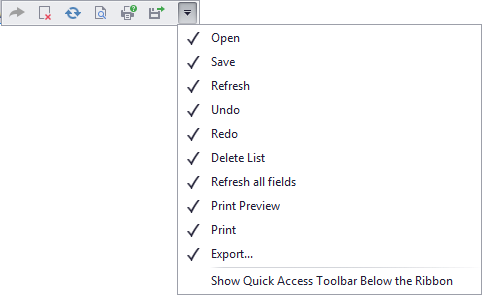
Figure 13 - Select buttons to be displayed
In addition, you can also position the header menu below the plug-in menu, if you prefer this display.
You have a number of options for adding content to a document.
For example, if you have stored content – such as a visualization from a different plug-in – in the clipboard, you can paste this content in the document using the shortcut CTRL + V.
You can also load elements to the document via the Insert tab (see Figure 5).
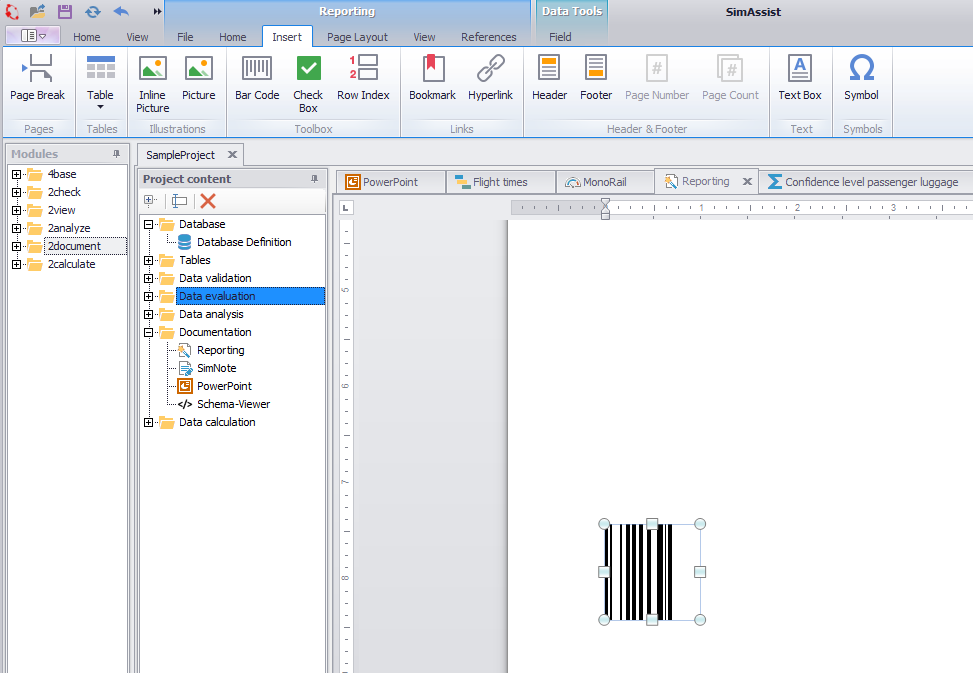
Figure 14 - Insert fields
In the example above (Figure 14), a barcode has been inserted in the document. All elements – check boxes, tables, pages, bookmarks, as well as various charts for visualizing data – can be included in this way.
You can also add the content of other plug-ins to your documentation using Drag&Drop.
To do so, simply move the desired plug-in or plug-in instance from the Project content area to the Reporting document (see Figure 15).
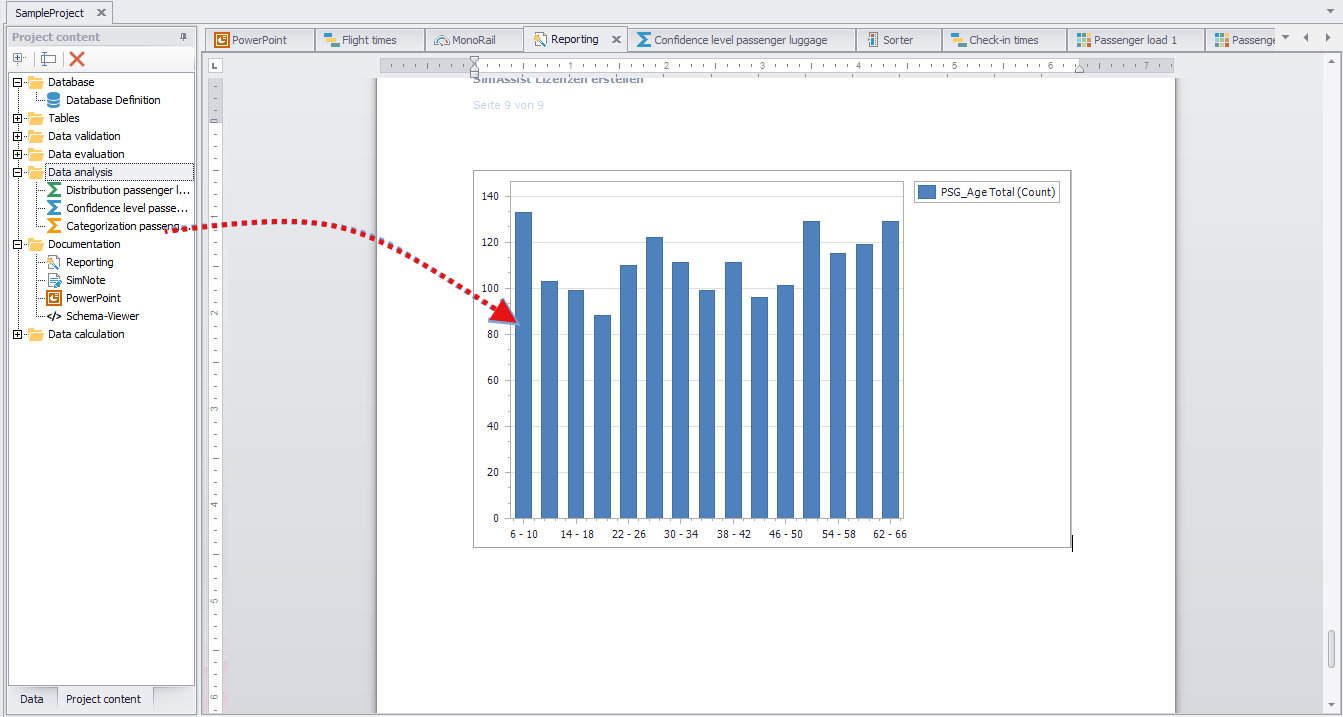
Figure 15 - Add plug-ins as content
In the example above, the Categorization plug-in chart has been integrated in the project documentation.
Some plug-ins support a selection of content, which means that you can choose exactly which content you want to transfer to the Reporting document.
In this case, a selection dialog box appears following the Drag&Drop procedure:
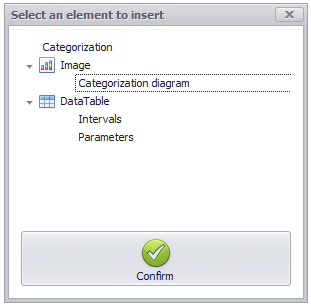
Figure 16 - Selection dialog box
Here you can specify in detail which components of the plug-in should be copied as content into your document (the scope of the selection depends on the selected plug-in).
Image lists all the images found in the plug-in to be added. DataTable includes all data tables, such as the result of the categorization.
Now mark the desired content with a click and press the Confirm button. Then you will find the content you selected in the reporting document.
Please note that elements can only be added individually and a multiple selection is not possible.
In addition to inserting plug-in instances, you can also drag entire folders from your project content into the reporting plug-in and transfer that much content to the document in one step (see Figure 17).
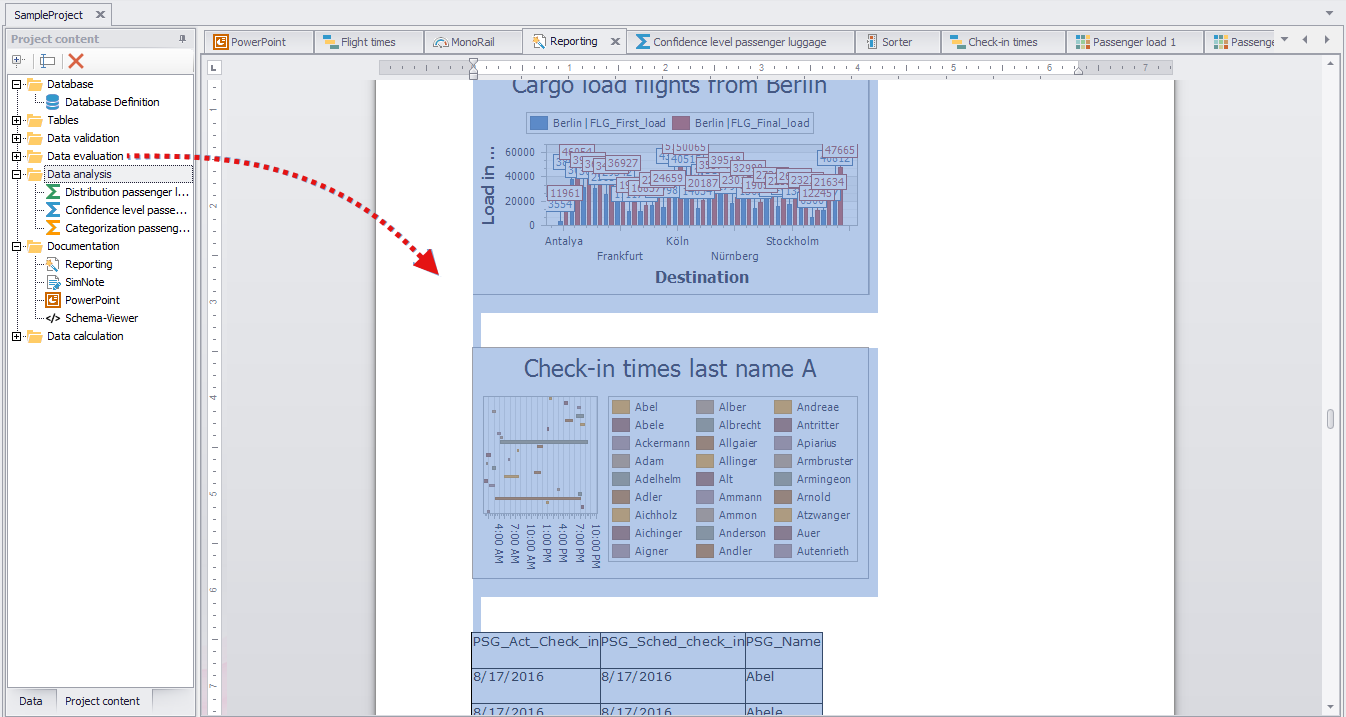
Figure 17 - Insert all folders
Adding plug-in content to a reporting document works with many plug-ins, but not all.
If a plug-in does not support this feature or there is another problem with the plug-in added, there are several ways the user is informed:
Option 1: Information message
If it is not possible to add the plug-in to the reporting plug-in, the following message may appear.
This indicates that the added plug-in currently has no results that could be displayed in the reporting plug-in (see Figure 18).

Figure 18 - Info message
Option 2: Dialog with grayed-out elements
Another way to display an alert when adding items to the reporting plug-in can be the dialog shown in Figure 19.
An attempt was made to add an empty table plug-in. The dialog shown (similar to Figure 16) shows the available elements of the table plug-in.
However, the table can not be added here because the plug-in has no attached data. Because of this, the item table is grayed out.
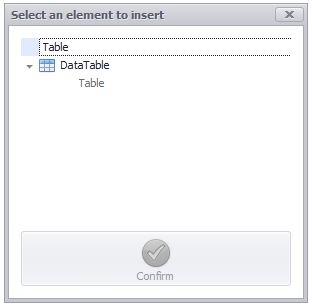
Figure 19 - Grayed Dialogue
Option 3: Icon of the mouse pointer changes
Attempting to add a plug-in that does not support the reporting functionality is symbolized by the change in the mouse cursor.
In the example in Figure 20, we tried to add the SQL plug-in to the plug-in, which is currently not possible.
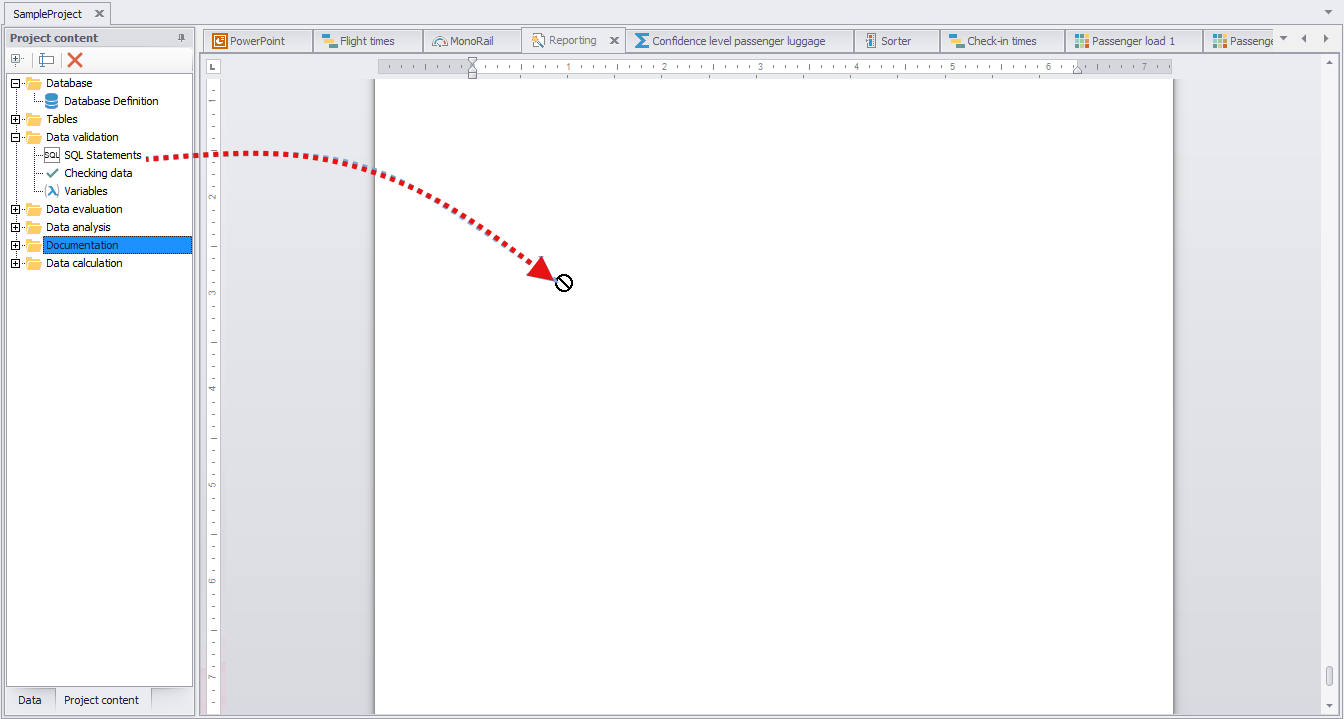
Figure 20 - Mouse Pointer Icon
You can edit fields that have been inserted in the document at any time. To do so, select the desired field, such as a barcode.
The additional Field tab will appear in the tab bar and be enabled at the same time. On this tab, you can access the settings for the relevant field in the document.
To do so, choose Properties on the Field tab. The associated options menu then opens (see Figure 21).
Here, depending on the type of field, you can adapt various options, including, for example, the type of field, the character set to be used and the position of the field in the text.
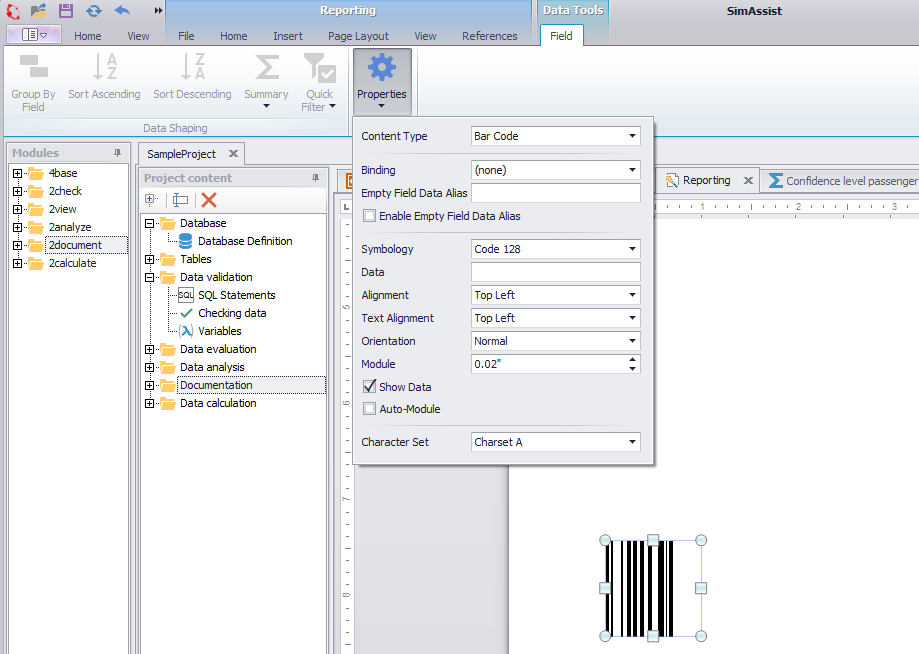
Figure 21 - Edit field options
3.3 How to Subsequently Refresh Content
Often there is the situation that a graph of any plug-in was inserted into a reporting document, but now there are still data or presentation changes to that graph pending and exported after reporting graphics is therefore no longer up to date.
In addition, the default size of the plug-in may be too small when added to the reporting plug-in. In this case, the graphic can be enlarged or reduced and recalculated by subsequent updating.
This can be done with just a mouse click and the graphics can be brought back up to date. To do this, first select the desired graphic and then perform one of the three possible actions:
•Click the Update All Fields button on the Quick Access toolbar of the plug-in (see Figure 12)
•Click on the Update all fields button in the File tab in the Ribbon Bar (see Figure 3)
•Right-click on the corresponding element and select the Update field entry in the context menu (see Figure 22)
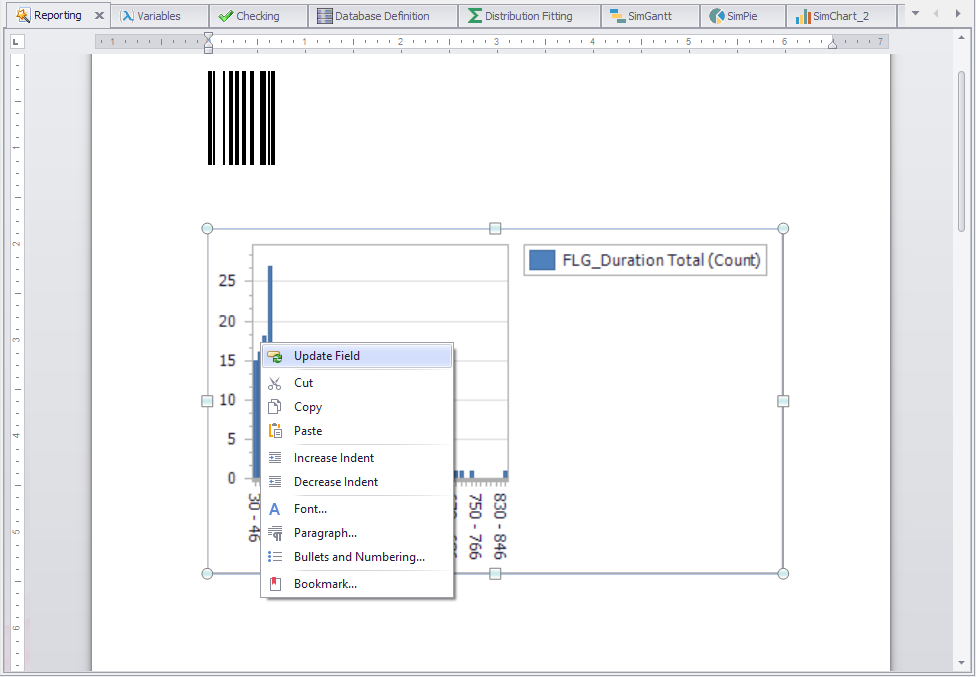
Figure 22 - Refresh fields
You will then notice that the graphic has been automatically updated and now once again matches the plug-in instance that you previously added to the Reporting document (see Figure 23).

Figure 23 - Updated graphic
You can choose to export documents from the Reporting plug-in. To do so, choose the File tab in the tab bar and then choose Export.
The default Windows dialog box for saving files then opens, in which you can assign a file name and choose the file format and storage path. You can choose from the following file formats:
•Portable document format (*.pdf)
•MS Word 2007 (*.docx)
•Open document (*.odt)
•Rich text format (*.rtf)
•Hypertext markup language (*.htm)
© SimPlan AG - Hanau District Court, Commercial Register (Part B) 6845 - info@simplan.de - www.simplan.de/en