Input data
Three input variables are required for regression analysis. On the one hand, a result parameter, which is mapped on the X-axis. On the other hand, a factor variable, which is shown on the Y-axis.
The behavior of these two inputs is filtered by a filter factor size (Figure 3). The filter factor size can also be the cluster assignment from clustering.
Figure 1 shows an example of the input field.

Figure 1 - Example Input of the Regression Analysis
Parametrization
The parameterization in the regression analysis is only used if it is a continuous filter variable or the individual values of the filter variable are more than 10.
Continuous filter variables are, for example, percentages, times or very finely resolved manipulated variables.
In this case, the Continuous filter size parameter is set to "True" and the Filter intervals parameter is used to define the number of filter intervals to be used.
The number of filters set should not exceed 10. Figure 2 shows an example of the available parameters.
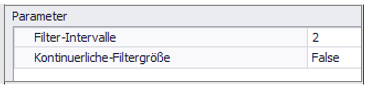
Figure 2 - Parametrization of the Regression Analysis
Interpretation example
Regression analysis can be used to detect linear relationships (red line) in large data sets and quantify them using coefficients (red formula in the upper right corner).
Figure 3 shows a regression analysis for the relationship between the parameters Proportion_of_model_A_of_total_production and Downtime_production_h filtered by the calculated clusters.
Forecasts can also be made using the formula at the corresponding graph. If the overall data are considered, a slight linear relationship can be recognized.
Here, an increase of the percentage share A of the total production by 1% leads to a predicted increase of the downtime by 20 minutes (0.33*1 = 0.33 [hours] = 20 [minutes]).
In the views filtered by clusters, it is also clear that cluster 1 includes much more stable experiments and also has a maximum downtime of 12 minutes.
Here, a 1% increase in fraction A only leads to a predicted higher downtime of 6 minutes (cluster 0: about 20 minutes, cluster 2: about 10 minutes).
This also shows that the experiments of cluster 1 provide the best performance in terms of downtime and proportion of model A.
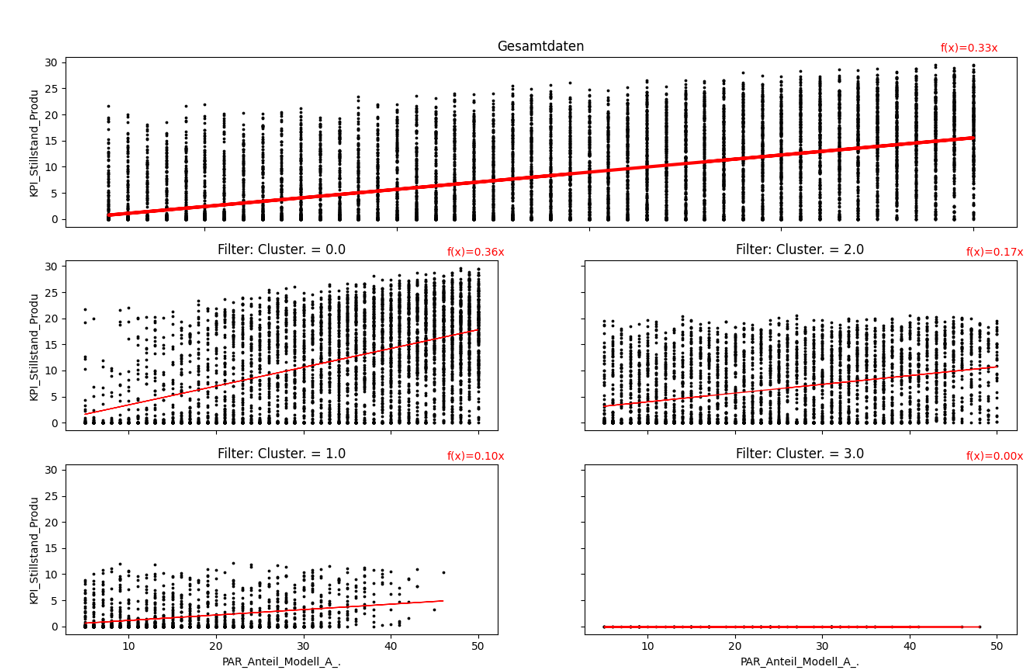
Figure 3 - Regression analysis
© SimPlan AG - Hanau District Court, Commercial Register (Part B) 6845 - info@simplan.de - www.simplan.de/en