Input data
The data is mapped to the radar plots as min, max values, quantiles and the average (ratios). Each specified input value is assigned a line from the center to the edge.
The ratios are plotted on this line and connected to the corresponding other ratios of the other input data.
Furthermore, a filter is specified, which is a categorical factor or the cluster assignment. Figure 1 shows an example of the input field.

Figure 1 - Example Input Radar Plots
Parametrization
Different scaling methods are available as parameters. On the one hand, it is possible to do no scaling.
This is not recommended, since as soon as an input value is larger than the others by a multiple, these are no longer differentiable.
The first scaling method is the MinMaxScaler which assigns the new value "1" to the highest original value and "0" to the lowest one.
The values in the intermediate range are scaled on this basis. If it is known that there are outliers in the data, the normalizer should be used.
This scales the values to a uniform norm and is therefore less sensitive to outliers. Figure 2 shows the parametrization with the MinMaxScaler.
Figure 2 - Parametrization Radar Plots
Interpretation example
Radar plots can be used for multidimensional analysis of influences of manipulated variables on cluster membership or proficiencies of KPIs.
The following statistical measures are available for this purpose:
•Min value
•Max value
•25% quartile
•Average
•75% quartile
In the following example, clusters 3 and 1 were classified as very good by previous analyzes and the question arose as to which parameters have an influence on membership of these clusters.
In Figure 3, it quickly becomes clear that membership in Cluster 3 results from a 0% share of Model B in total production.
In comparison, cluster 1 results from a rather low share of models A and B with a high production volume. A very high share of model A and B results in an assignment to cluster 0.
The parameters of the delivery cycle and the number of buffer locations do not seem to have any influence in this example, as they have similar characteristics in all clusters.
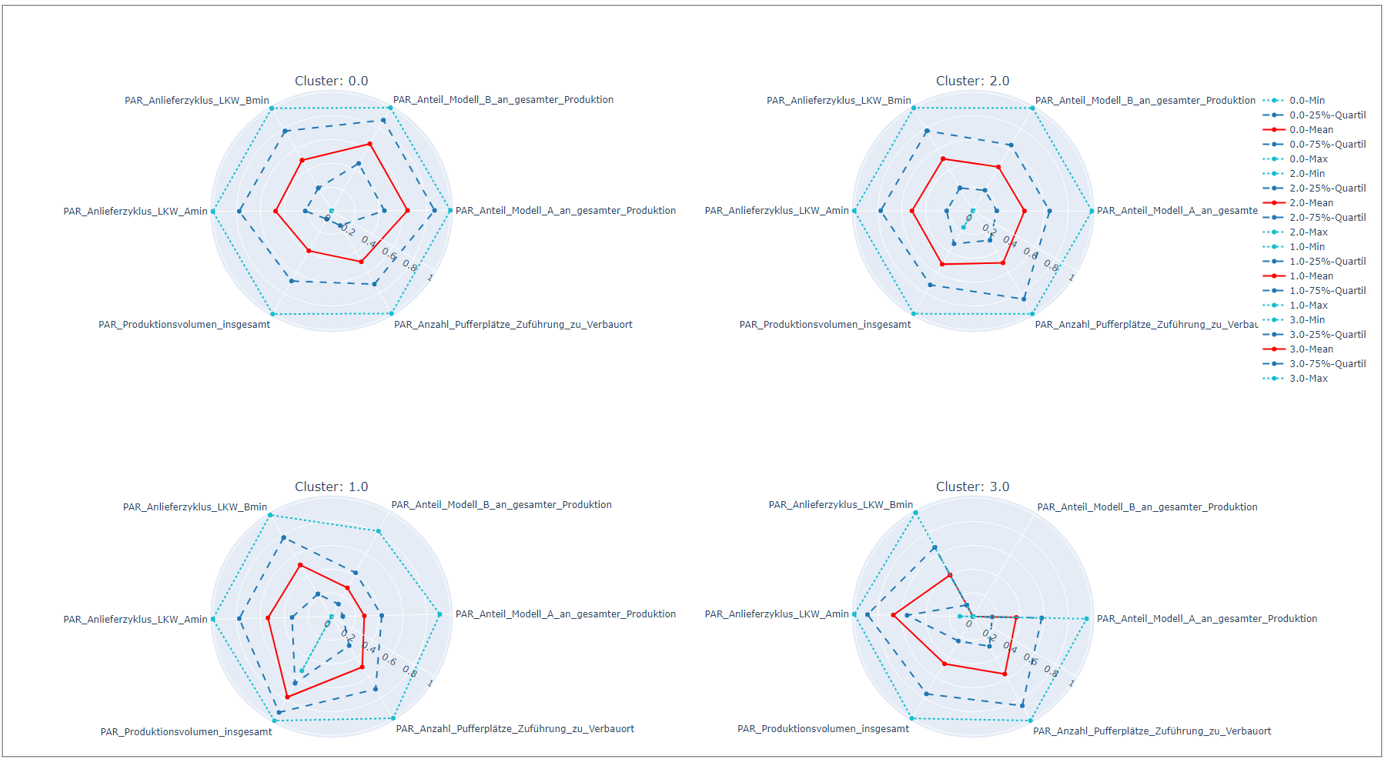
Figure 3 - Radar plot analysis
© SimPlan AG - Hanau District Court, Commercial Register (Part B) 6845 - info@simplan.de - www.simplan.de/en