The following comprises instructions for the Cranes plug-in.
Contents
1. Introduction to the plug-in
1.3 Position in the overall software package
1. Introduction to the plug-in
The performance of technical components such as cranes, lifters or transfer cars be determined by so-called reference cycles.
These are defined on the one hand via the technical data of the components and on the other hand via the defined approach positions within a reference cycle.
The Cranes plug-in offers the possibility to run these cycle time calculations, graphically supported, fast and easy to compare.
Cranes is integrated as a plug-in in SimAssist.
In accordance with the basic modular concept, the full functionality of the SimAssist main menu is available and, for example, multiple instances of the plug-in can be created or the project can be saved and reopened at a later date.
There is also a connection to the PowerPoint and reporting interface for documentation.
1.3 Position in the overall software package
The Cranes plug-in is part of the 2calculate module, which also includes the monorail and sorter plug-ins.
Cranes is available to you if you have licensed the module 2calculate for SimAssist.
The Cranes plug-in provides a link to the PowerPoint and Reporting plug-ins. Thus, the results of the calculation from the RBG plug-in can be converted into a presentation or a report.
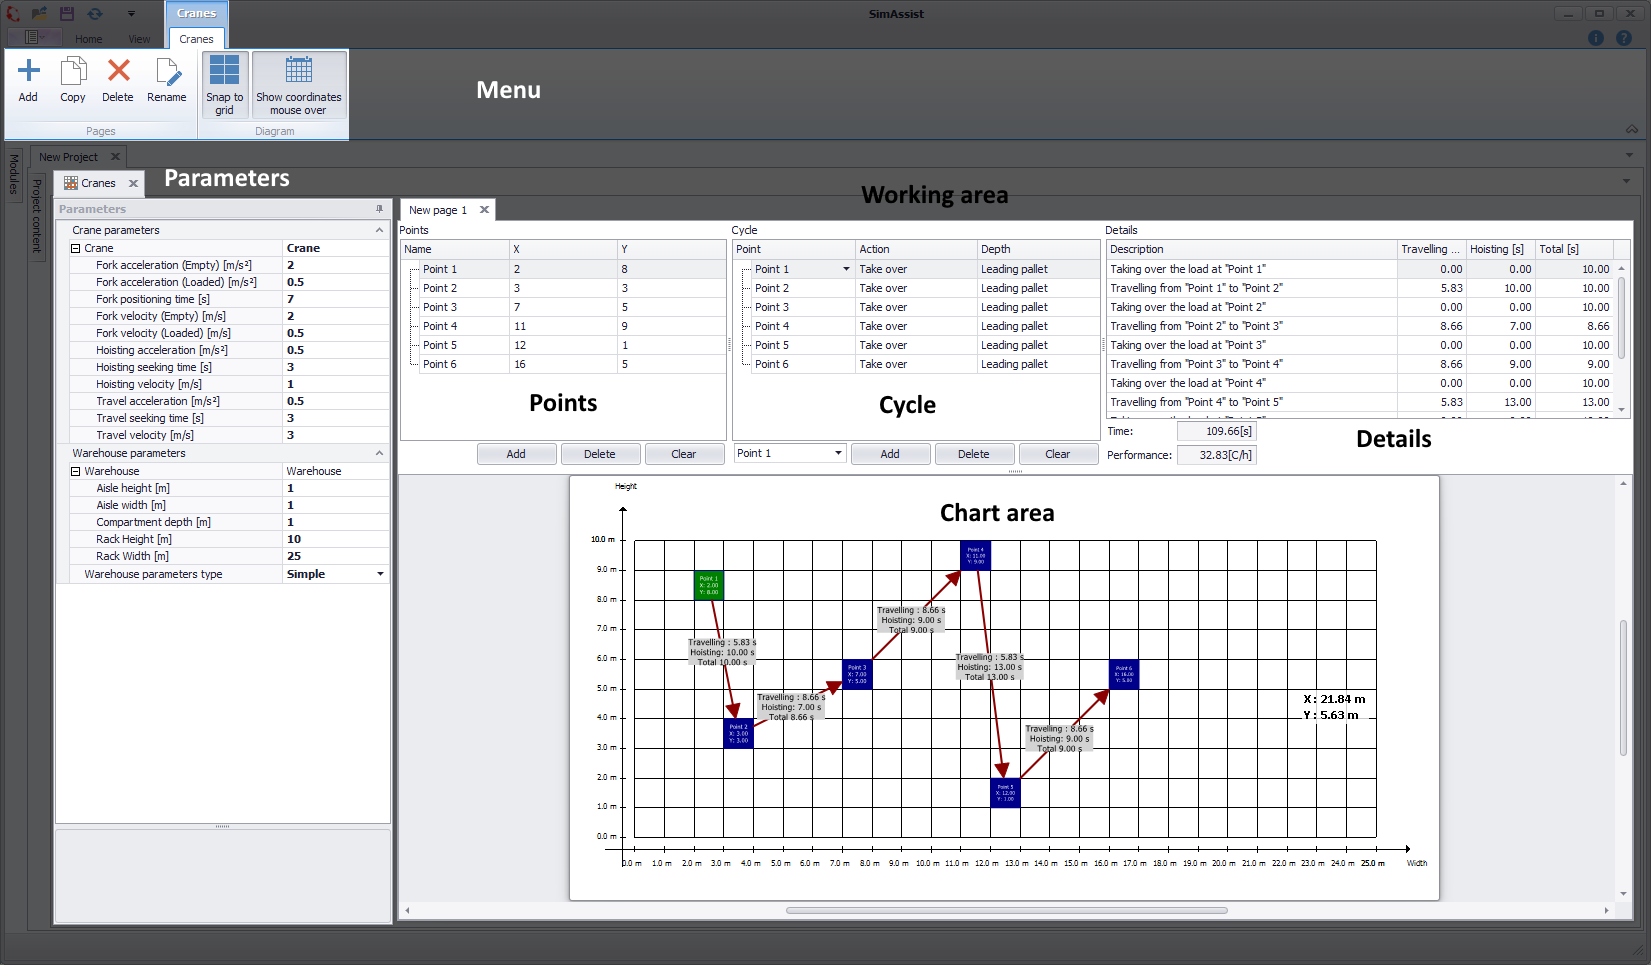
Figure 1 - Interface Cranes
The structure of the Cranes plug-in is divided into 3 sections (see Figure 1). In the upper area is the menu. The individual buttons are explained in more detail in the course of this help file.
Below that is the Parameters section, where you can specify custom parameters for the Crane and the Warehouse.
Most of the plug-in space is used for the workspace. This can contain one or more tabs (New page 1). Each of these tabs is divided into the elements Points, Cycle and Details.
At the bottom of the workspace is the chart area with the visualization of the created elements.
This area is interactive, i.e. it is also possible to add additional points or edit existing ones via the context menu.
The individual control elements are listed and explained below.
In the table below, the buttons of the menu (see Figure 2) are listed and explained.

Figure 2 - RBG Menu
Button |
Description |
|
Adds a new tab to the working area |
|
Copies the currently selected tab in the working area and adds the tab |
|
Deletes the currently selected tab from the working area |
|
Opens a dialog to rename the currently selected tab |
|
Enables / disables aligning elements on the grid in the chart area |
|
Enables / disables the display of coordinates of the elements in the chart area |

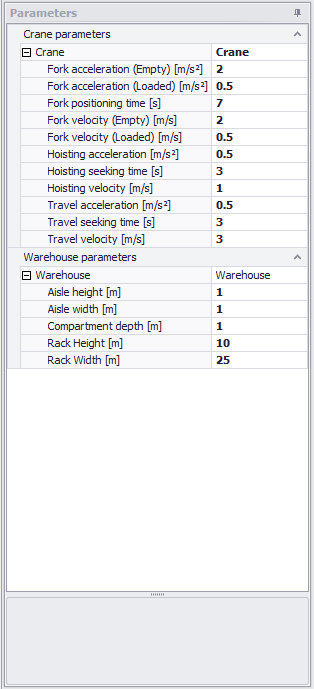
The table below lists and explains the entries in the Parameter field (see Figure 3).
Figure 3 - Parameters |
|
||||||||||||||||||||||||||||||||||||||||||
In this section, points can be created using the Add button and then their coordinates entered in the columns X and Y (see Figure 4).
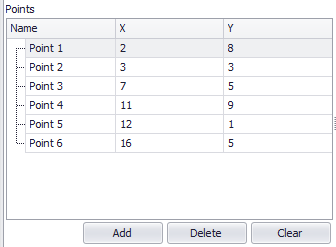
Figure 4 - Adding points
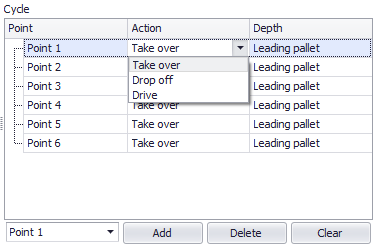
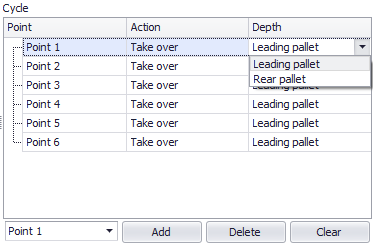
In the Cycle section, cycles can be created from existing points. To do this, first select the desired point from the drop down box and then click on the Add button.
Use the drop downs in the Action and Depth columns to configure each cycle (see Figures 5a and 5b). As soon as a cycle is created, the corresponding point appears in the chart area.
Figure 5 - Set cycle |
Figure 5a - Set action |
Figure 5b - Set depth |

In this area, the details of the created cycles as well as the times for travel and lifting processes are listed in a table. Below, the key figures total time and performance are displayed (see Figure 6).
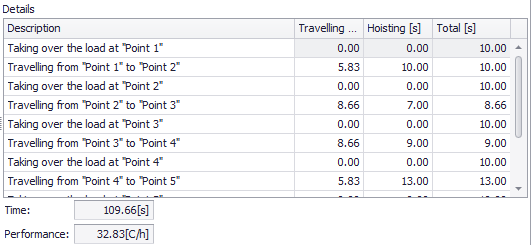
Figure 6 - Details
The chart area displays an interactive diagram. By holding down the mouse button the chart can be moved as desired, with pressed [CTRL] key and by moving the mouse wheel at the same time you can zoom in or out.
A chart can be created in two ways. Once, as described in 3.3.2 cycle and once via the context menu of the diagram (see Figure 7).
If you click on the entry Add drive/takeover/drop off point, it will be added to the chart at the mouse cursor position and added to the list of the Points, Cycle and Details area.
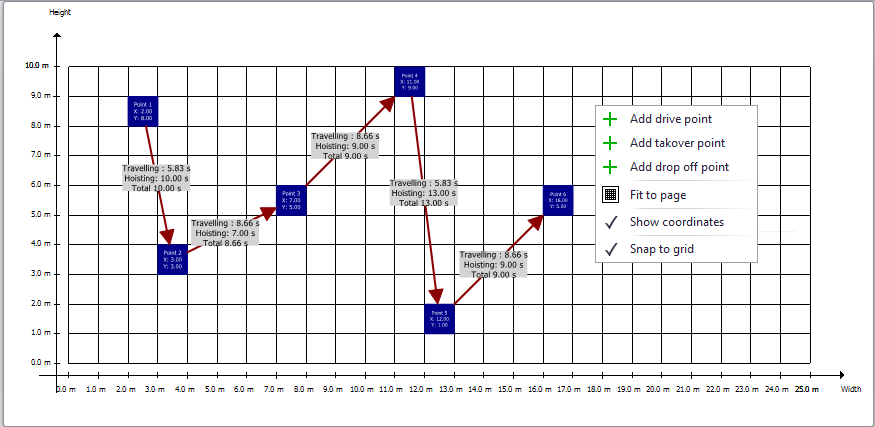
Figure 7 - Adding a point via context menu
If you click on a point with the right mouse button, further actions can be performed (see Figure 8).
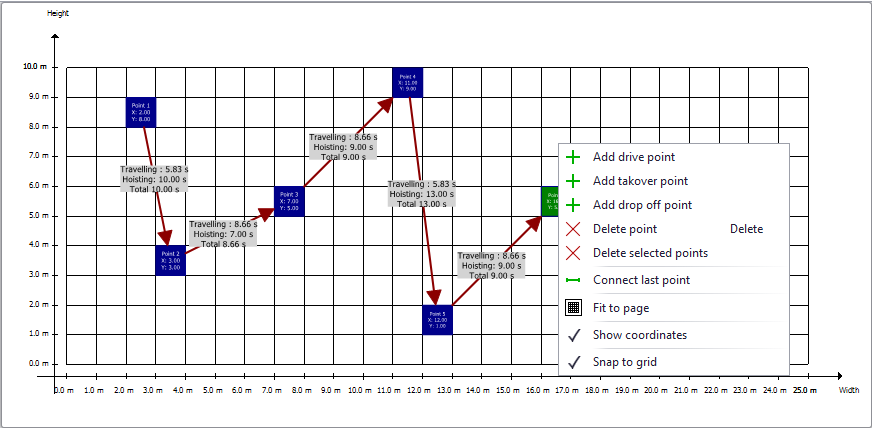
Figure 8 - Context menu of a point
© SimPlan AG - Hanau District Court, Commercial Register (Part B) 6845 - info@simplan.de - www.simplan.de/en