Input data
The data for the correlation analysis must be divided into three categories: manipulated variables, categorical manipulated variables and target variables.
The factors which can be adjusted in the simulation model or are variable belong to the manipulated variables.
A special case are the categorical manipulated variables, which are non-numerical manipulated variables - for example classes like: scenarios or sorting strategies.
Target variables include the data generated by the simulation model that reflect the results of the experiment run.
Counter variables such as the experiment number, among others, are not used as input. Figure 1 shows the input field of the variables for an example
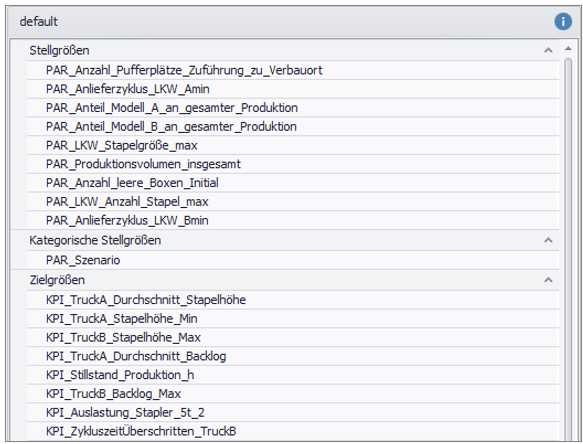
Figure 1 - Example input of correlation analysis
Interpretation example
The correlation matrix is used to get a first insight about simple relationships between parameters. The values in the cells indicate how the parameters relate to each other.
For example, a value of "1" means that one value increases when the other increases.
With a value of "-1" it behaves the other way round, here the value of one parameter decreases if the other increases, and vice versa.
For example, in the area marked in black in Figure 2, the KPI Cycle timeOvershot has a negative correlation with respect to the manipulated variable Delivery cycle_Truck_Bmin.
This means that a high delivery cycle results in an average low exceeded cycle time.
The area highlighted in blue represents the relationship between the parameter Delivery cycle_Truck_Bmin and the KPI TruckB_stack_height_min. Here, for example, a slight positive correlation can be seen.
A larger distance between the arrival of the trucks leads to an average higher minimum loading of these trucks.
Using these relationships, initial, simple conclusions about the system can be drawn from the correlation matrix.
This makes it possible to validate logical system behavior (blue area), but also to detect unexpected behavior (black area).

Figure 2 - Section Correlation Matrix
Correlation analysis can also be used to validate experiment design.
Because of the requirement that a good experiment design be orthogonal, the manipulated variables must be minimally correlated with each other.
This can be checked by looking at the correlation in the quadrant of the manipulated variables.
Figure 3 shows an example of a good experiment design, as any correlation between the manipulated variables is close to 0.
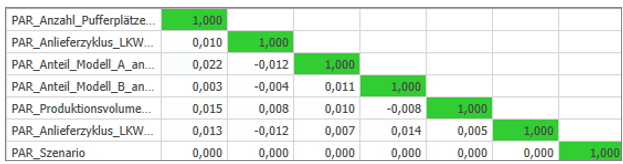
Figure 3 - Checking the experiment design
© SimPlan AG - Hanau District Court, Commercial Register (Part B) 6845 - info@simplan.de - www.simplan.de/en