Input data
In the data mining method of classification tree, the input data is divided into two groups. First is the cluster ID, which is the cluster assignment of the clustering.
No other inputs are needed here. The second category is the factor variables, which are to be used to explain the cluster assignment. Figure 1 shows an example of the input field.
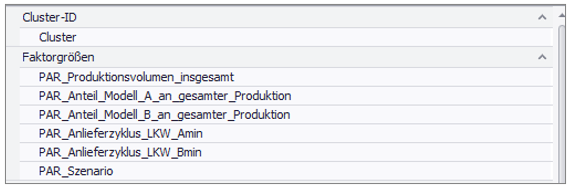
Figure 1 - Example Input Classification Tree
Parametrization
The maximum depth and the minimum leaf size are available as parameters for the classification tree.
The maximum depth is the parameter that specifies how many levels the classification tree has or what depth.
The minimum leaf size indicates how many experiments would have to be minimally assigned to a decision rule for the classification to be made.
Figure 2 shows an example parametrization for a classification tree with a maximum depth of 5 and a minimum leaf size of 50.
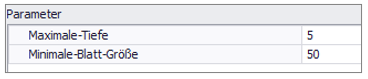
Figure 2 - Parametrization Classification Tree
Interpretation example
The classification tree is a rule extraction method for real-world scenarios.
Through it, after identifying the cluster with the desired performance, rules can be identified which lead to this result in the real world scenario.
Or in the case of a bad cluster, which parameter settings should be avoided in the system.
In the example in Figure 3 (section of the classification tree), we assume that cluster 1 has been classified as very good in terms of performance by previous analysis.
Using the classification tree, it is possible to derive rules that lead to this performance in the real scenario. For this purpose the "leaf" is searched, which contains a large part of the experiments of cluster 1.
From this leaf the rule can now be derived by following the red path to the last leaf.
This results in the following settings for the scenario if the performance of cluster 1 is to be achieved:
Parameter |
Value |
Proportion_Model_Bof_Total_Production |
<29.5% |
Production_volume_total |
>37.5 units per hour |
Share_of_model_A_in_total_production |
<28.5% |
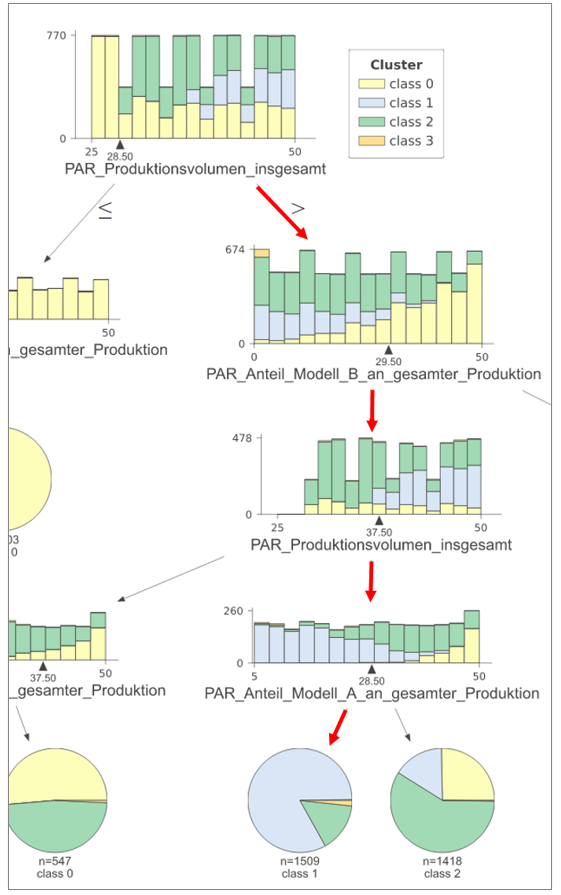
Figure 3 - Classification tree
Figure 4 represents a complete classification tree with depth of 5. This clearly shows the size that the classification trees can take.
But also the possibilities to derive different rules for different scenarios are manifold.
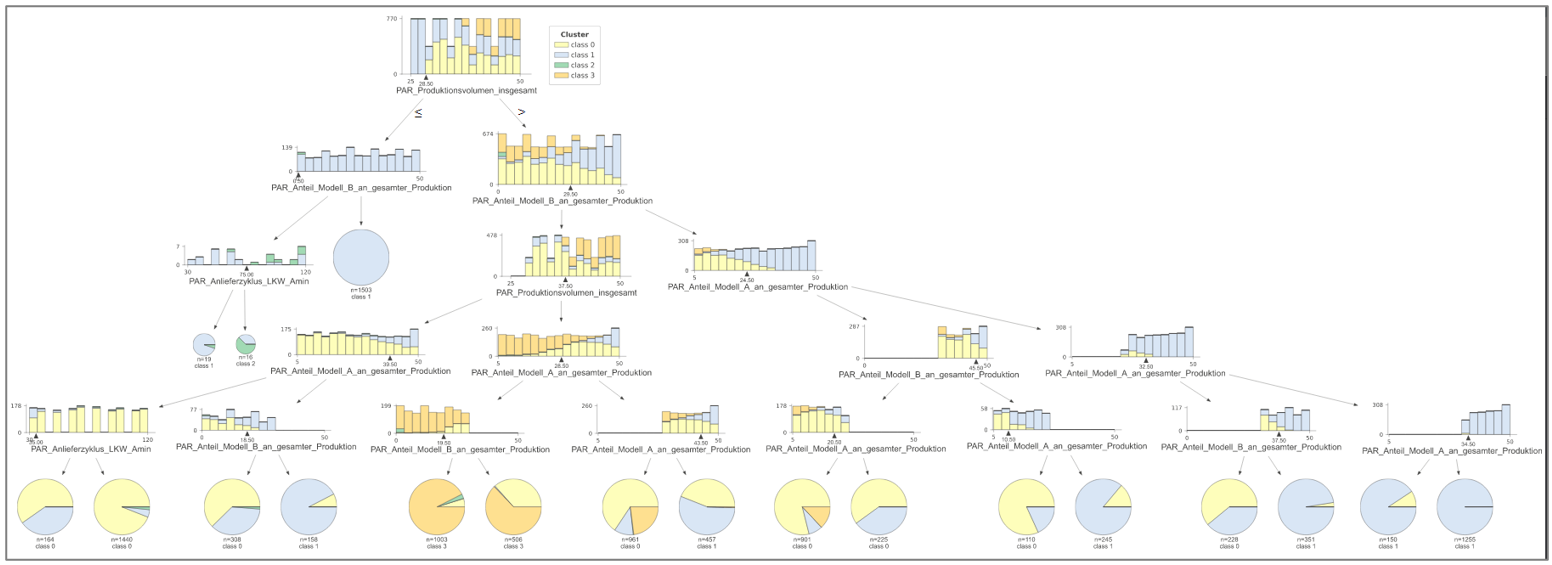
Figure 4 - Complete Classification Tree
© SimPlan AG - Hanau District Court, Commercial Register (Part B) 6845 - info@simplan.de - www.simplan.de/en